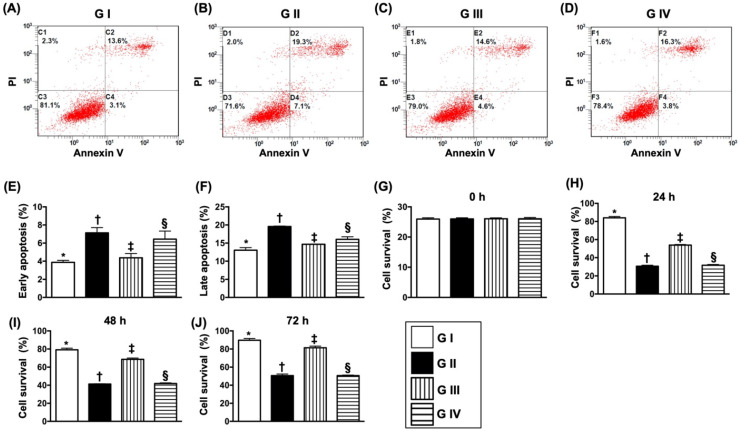
Figure 8.
Sitagliptin preserved the cell survival rate and against cellular apoptosis in situation of oxidative stress. (A-D) Illustrating the early (AN-V+/PI-) and late (AN-V+/PI+) N2a cell apoptosis. (E) The percentage of early apoptosis, * vs. other groups with different symbols (†, ‡, §), p<0.0001. (F) The percentage of early apoptosis, * vs. other groups with different symbols (†, ‡, §), p<0.0001. (G) The percentage of late apoptosis, * vs. other groups with different symbols (†, ‡, §), p<0.0001. (H) MTT assay for cell survival rate at 0 h, p<0.5. (I) MTT assay for cell survival rate at 24 h, * vs. other groups with different symbols (†, ‡, §), p<0.0001. (J) MTT assay for cell survival rate at 48 h, * vs. other groups with different symbols (†, ‡, §), p<0.0001. (K) MTT assay for cell survival rate at 72 h, * vs. other groups with different symbols (†, ‡, §), p<0.0001. All statistical analyses were performed by one-way ANOVA, followed by Bonferroni multiple comparison post hoc test (n=4 for each group). Symbols (*, †, ‡, §) indicate significance (at 0.05 level). Group I = Na2 cell only (i.e., control group); Group II = N2a cell treated by H2O2; Group III = N2a cell treated by H2O2 and sitagliptin; Group IV = N2a cell + H2O2 + sitagliptin + LY-294002.

