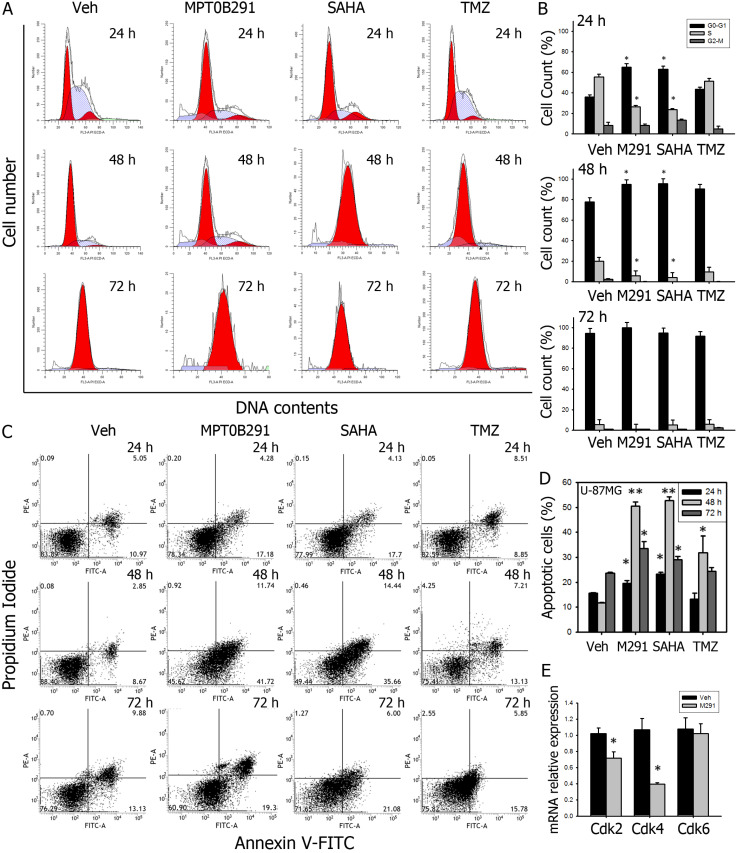
Figure 3.
MPT0B291 induces G1 cell cycle arrest and apoptosis in U-87MG cells (A) Representative histograms showing flow cytometry analysis of cell cycle analysis on U-87MG cells treated with vehicle, MPT0B291 (30 µM), SAHA (30 µM) and TMZ (30 µM) for 24 h, 48 h and 72 h. (B) The percentage of the U-87MG cells in different cell cycle stages is presented as mean ± SEM (n=3 in each group). (C) Representative histograms showing flow cytometry analysis of Annexin V/PI stained U-87MG cells treated with vehicle, MPT0B291 (30 µM), SAHA and TMZ for 24 h, 48 h and 72 h. (D) Percentages of apoptosis cell population are presented as mean ± SEM (n=3 in each group). (E) The relative mRNA expression levels of Cdk2, Cdk4 and Cdk6 in vehicle- and MPT0B291-treated C6 cells are presented as mean ± SEM (n=3 in each group) *p<0.05 versus vehicle-treated group.

