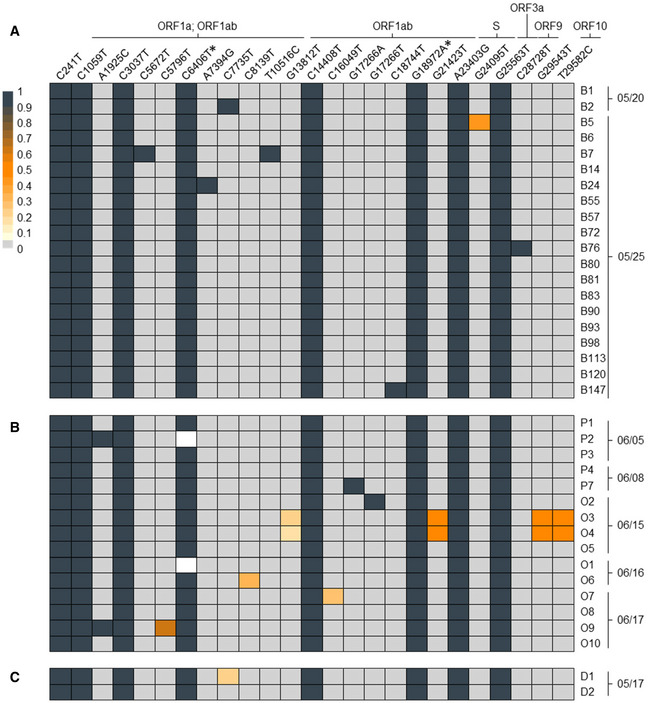
The heat map shows the position (left to right), identity (top row), and frequency (color code) of variant nucleotide positions detected by SARS‐CoV-2 full genome amplicon sequencing in (A) 20 samples of MPP‐R workers tested positive on May 20 or 25, (B) 15 samples of MPP‐R workers tested positive between June 5 and 17, and (C) two workers from MPP‐D who may have transmitted the virus to cases B1 and/or B2. Individual collection dates are shown to the right of each sample. Variant sequences are given relative to the Wuhan reference strain
NC_045512. The two silent mutations which define the prototype of the investigated outbreak are marked with an asterisk. Frequencies below 100% mean that only a fraction of viral genomes shows nucleotide variations, indicating the presence of viral intra‐host sub‐populations. White rectangles denote nucleotide positions which were not covered by amplicon‐seq reads within the respective sample. For nucleotide positions in coding regions, the corresponding viral ORF(s) are shown above the variant position. Variants without such information are located in non‐coding regions. Absolute values for variant frequencies and amino acid changes associated with nucleotide variants, along with identifiers of entries which were submitted to GISAID are provided in
Appendix Table S1.

