
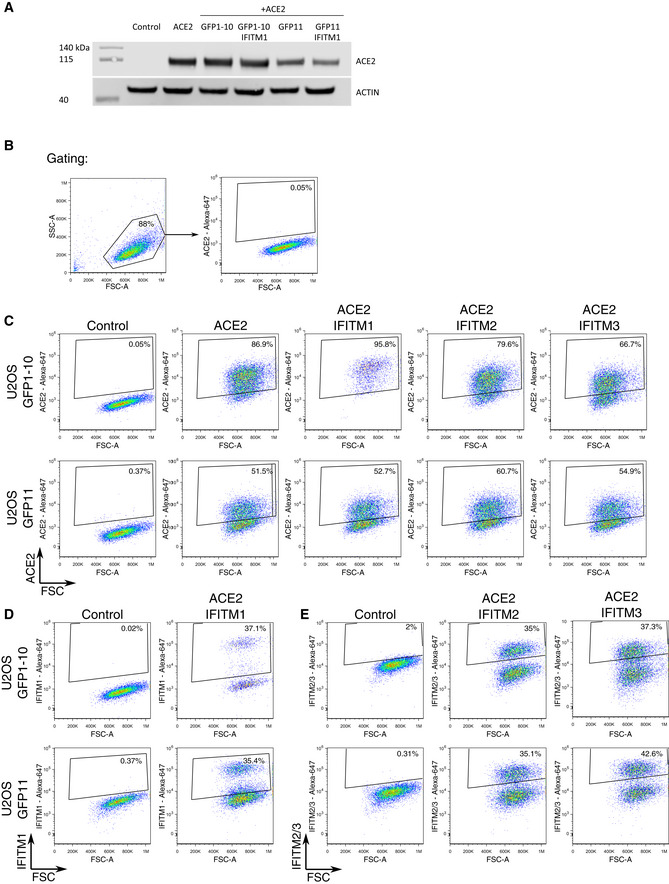
Figure EV1. ACE2 and IFITM expression in U2OS‐ACE2 cell derivatives.
-
AACE2 expression assessed by Western blot in U2OS‐ACE2 GFP‐split cells expressing or not IFITM1. Cell lysates were analyzed by for ACE2 and actin as a loading control.
-
B–EAnalysis of ACE2 and IFITMs levels by flow cytometry B. Gating strategy. Cells were gated by size and granularity. Positive and negative gates were then set on control U2OS cells lacking the protein of interest. C. ACE2 levels on parental U2OS (control) and various IFITM derivatives. D. IFITM1 levels on parental U2OS (control) and U2OS‐ACE2 IFITM1 cells. E. IFITM2 and IFITM3 levels on parental U2OS (control) and U2OS‐ACE2 IFITM2 and U2OS‐ACE2 IFITM3 cells.