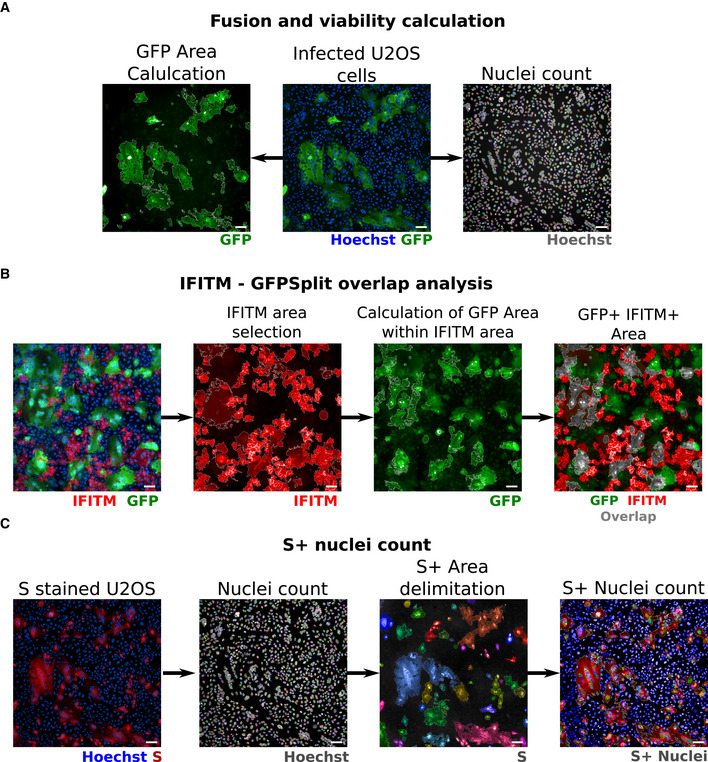
Figure EV2. Image quantification methodology.

-
AQuantification of fusion and viability. To measure the extent of cell–cell fusion, the GFP area was automatically delimited, measured, and then divided by the total cell area. For cell viability, nuclei were automatically counted, and the total number of nuclei per well was normalized to that of non‐infected control cells.
-
BQuantification of syncytia expressing IFITMs. For IFITM‐GFP overlap quantification, the IFITM+ area was first selected on the 647 nm channel (image 2) and the GFP‐positive area was quantified within the IFITM+ area (image 3). Image 4 shows the overlap area in gray for simpler visualization.
-
CQuantification of infected cells expressing the S protein. The cells were stained with anti‐S antibodies, and the nuclei were detected with Hoechst. The S+ area was delimited (each selected object is pseudo‐colored). Nuclei present within the S+ area were scored and divided by the total number of nuclei, to calculate the number of infected cells per well.
Data information: Scale bars: 100 µm. The same field was used in this example for A and C, Hoechst images are therefore identical in A and C.
