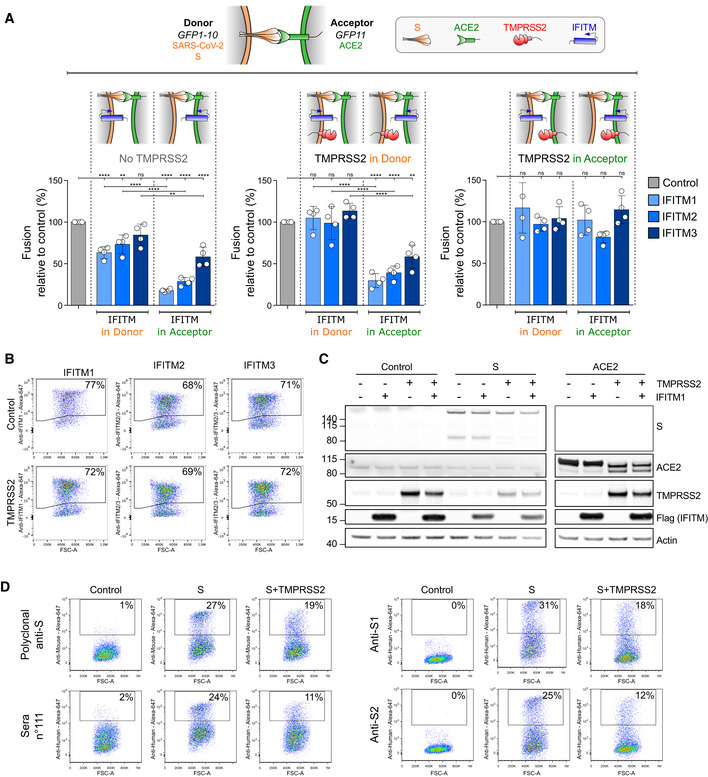
B–DImpact of TMPRSS2 on IFITMs, ACE2, and S levels. B. TMPRSS2 does not decrease IFITM amounts measured by flow cytometry. 293T cells were transfected with the indicated IFITM plasmids, with or without TMPRSS2, and analyzed 18 h later. C. Impact of TMPRSS2 on S and ACE2, measured by Western blot. 293T cells were transfected with or without IFITM1, TMPRSS2, S, or ACE2 plasmids, and analyzed 18 h later. D. TMPRSS2 decreases S surface levels, measured by flow cytometry. 293T cells were transfected with S plasmid, with or without TMPRSS2, and analyzed 18 h later. Murine polyclonal anti‐S antibodies, one serum from a convalescent COVID‐19‐infected patient (sera n°111), and two monoclonal antibodies (anti‐S1 and anti‐S2) were tested. Data are representative of three independent experiments.