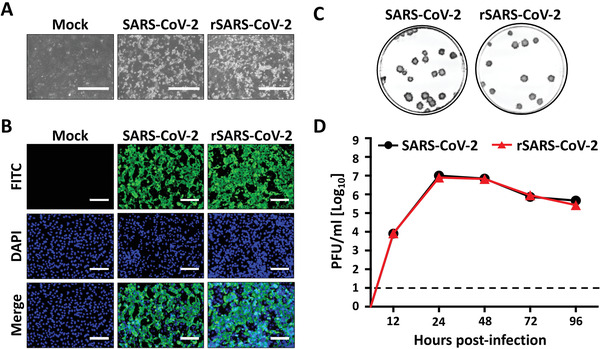
Figure 4.

Detection and in vitro characterization of rSARS‐CoV‐2. (A) CPE: At 48 hr after scaling up transfected Vero E6 cells into T‐75 flasks (Fig. 3), CPE can be already observed. Representative images of mock‐infected, SARS‐CoV‐2‐infected, and transfected Vero E6 are shown. Scale bars are 400 µm. (B) IFA: Vero E6 cells (12‐well plate format, 0.5 × 10⁶ cells/well, triplicates) were infected with tissue culture supernatants from transfected Vero E6 cells. Mock‐infected and SARS‐CoV‐2‐infected Vero E6 cells were included as internal controls. At 24 hr post‐infection, cells were fixed with 10% neutral buffered formalin. After fixation for 16 hr, cells were permeabilized with 0.5% Triton X‐100 for 10 min. Cells were then washed three times with 1× PBS and incubated with 1 μg/ml of an anti‐SARS NP MAb 1C7 at 37°C. After 1 hr incubation with the primary NP 1C7 MAb, cells are washed three times with 1× PBS and incubated with an anti‐mouse FITC‐conjugated secondary antibody at 37°C. After 1 hr, cells are washed three times with 1× PBS and observed under a fluorescent microscope. DAPI was used to stain the nucleus. Scale bars are 100 µm. (C) Plaque assay: Confluent monolayers of Vero E6 cells (6‐well plate format, 1.2 × 10⁶ cells/well, triplicates) were infected with SARS‐CoV‐2 or rSARS‐CoV‐2 at 37°C for 1 hr and overlaid with agar. After 72 hr in a 37°C incubator with 5% CO2, cells were fixed in 10% neutral buffered formalin for 16 hr before agar was removed. Next, cells were permeabilized with 0.5% Triton X‐100 for 10 min and prepared for immunostaining as previously described using the anti‐NP MAb (1C7) and vector kits (Vectastain ABC kit and DAB HRP substrate kit; Vector Laboratories). (D) Viral growth kinetics: Vero E6 cells (12‐well plate format, 0.5 × 10⁶ cells/well, triplicates) were infected (MOI of 0.01) with SARS‐CoV‐2 (black) or rSARS‐CoV‐2 (red) and placed in a 37°C incubator with 5% CO2 for 4 days. At 12, 24, 48, 72, and 96 hr post‐infection, viral titers in supernatants were determined by plaque assay (PFU/ml). Error bars indicate the standard deviations from three separate experiments. The dashed black line indicates the limit of detection (10 PFU/ml).
