FIGURE 2.

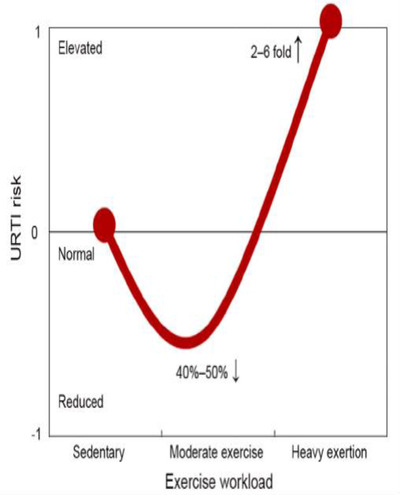
J‐curve model of the relationship between the exercise workload and risk for upper respiratory tract infection. This figure was adapted with permission from Niemanand Wentz 35

J‐curve model of the relationship between the exercise workload and risk for upper respiratory tract infection. This figure was adapted with permission from Niemanand Wentz 35