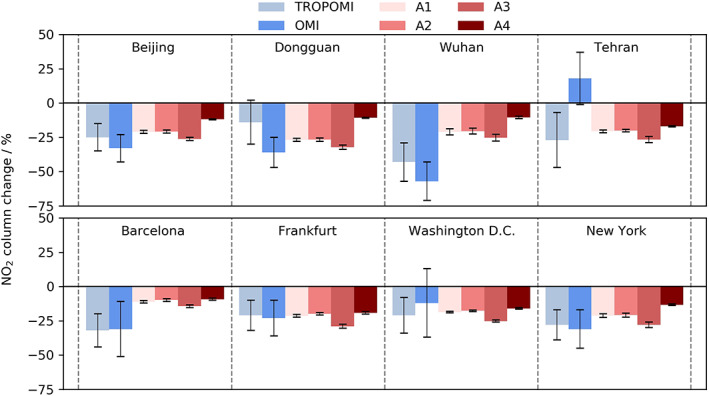
Figure 1.

Observed and modeled tropospheric NO2 column changes. Observations are from TROPOMI and OMI relative to 2019; see Bauwens et al. (2020) for more details. Model results are from the four scenarios relative to the control averaged over the period of lowest emissions (mid‐March to mid‐May).
