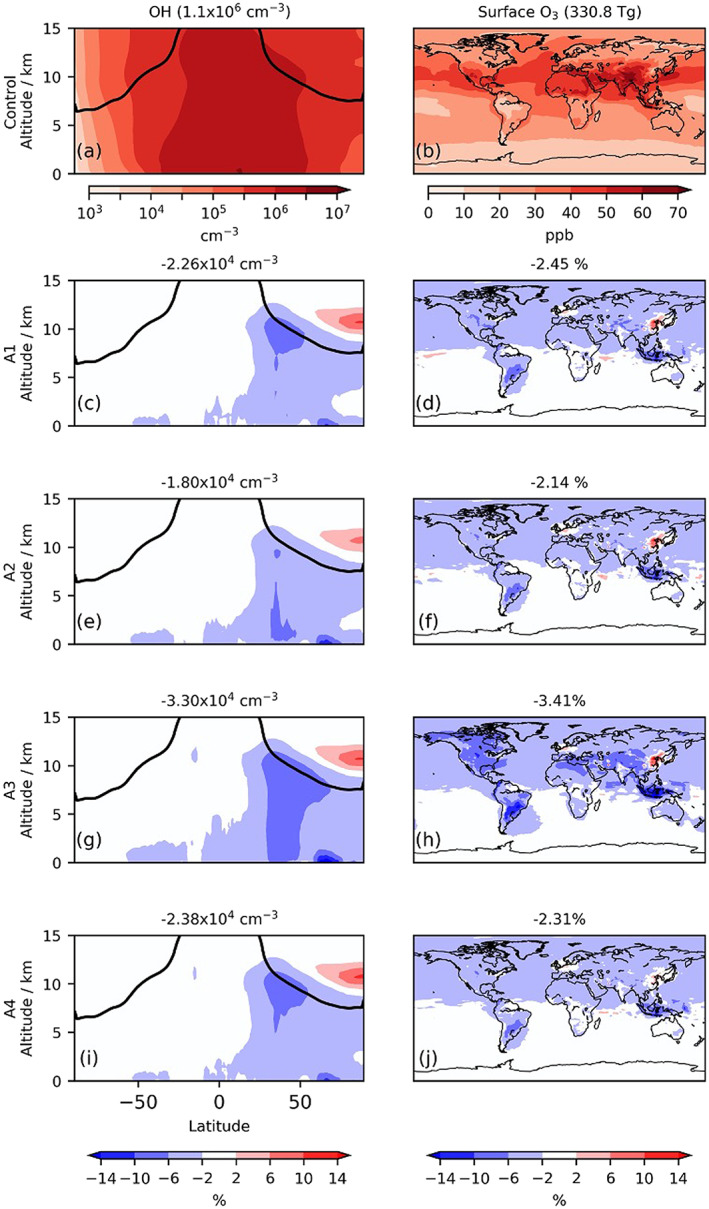
Figure 2.

Zonal mean OH and surface O3 mixing ratios in control runs and respective changes (mid‐March to mid‐May). Model results are the ensemble mean for each scenario. Black lines in the OH plots show the tropopause. Titles in the left column show mean tropospheric air‐mass‐weighted (OH) in control (top) and change (lower panels). Titles in the right column show mean tropospheric O3 burden in control (top) and change (lower panels).
