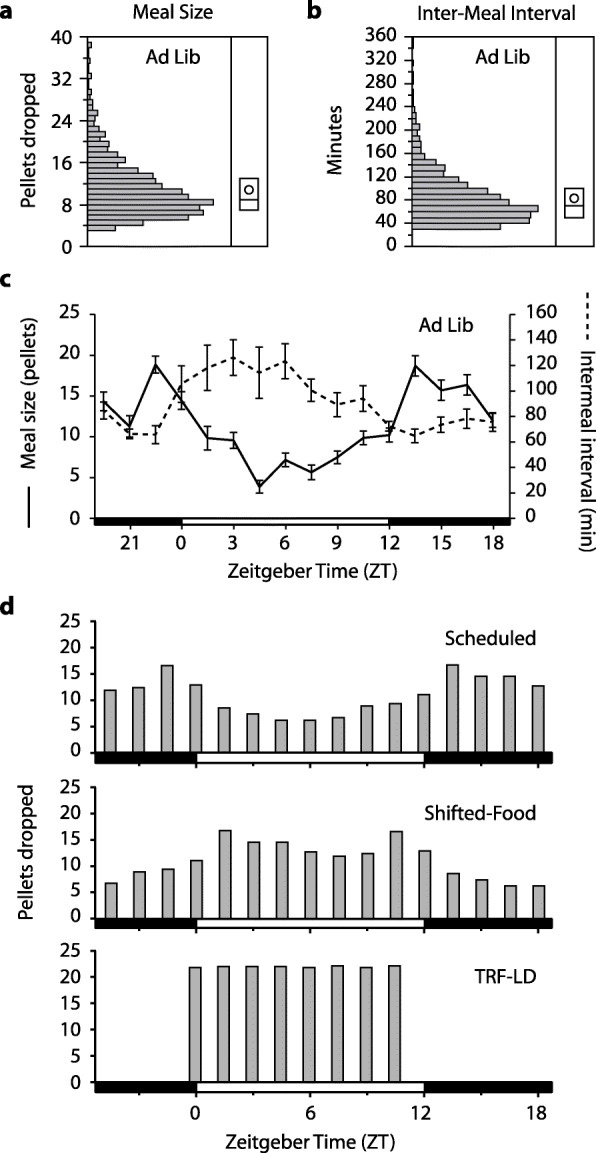
Fig. 2.

a, b Distributions of Ad Lib meal sizes in 20-mg pellets and inter-meal intervals in minutes (n = 10). The box plot shows the median and the 25th and 75th percentile; the mean is shown by the circle. c Both meal size and inter-meal interval varied with the time of day during Ad Lib conditions. The light-dark cycle is shown at the bottom, with Zeitgeber Time 0 (ZT0) and ZT12 defined as lights-on and lights-off, respectively. d The mean pellet drop schedules are plotted for Scheduled, Shifted-Food (12 h), and TRF conditions, all conducted in LD
