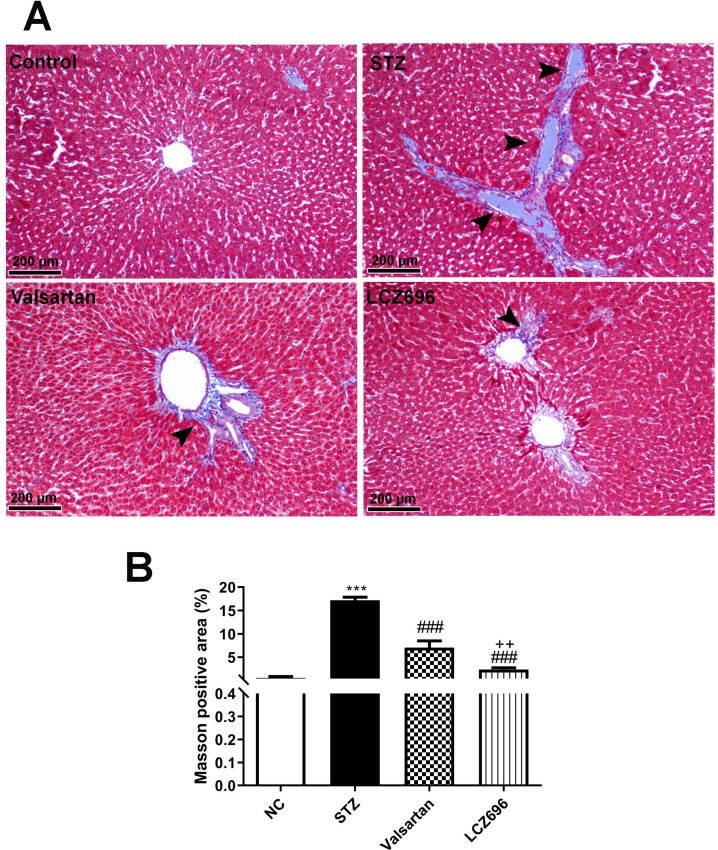
Figure 7.
Masson's trichrome staining for collagen in liver sections from control and experimental groups. (a), Representative staining image showing the degree of fibrosis (head arrow). (b), Quantification of Masson's trichrome staining using ImageJ software. Data are presented as mean ± SEM. in each group. The p values consider significant when ***P<0.001 compared with Control; ###P<0.001 compared with STZ-group and ++P<0.01 compared with valsartan group (One-way ANOVA followed by Student Newman-Keuls as post hoc test).

