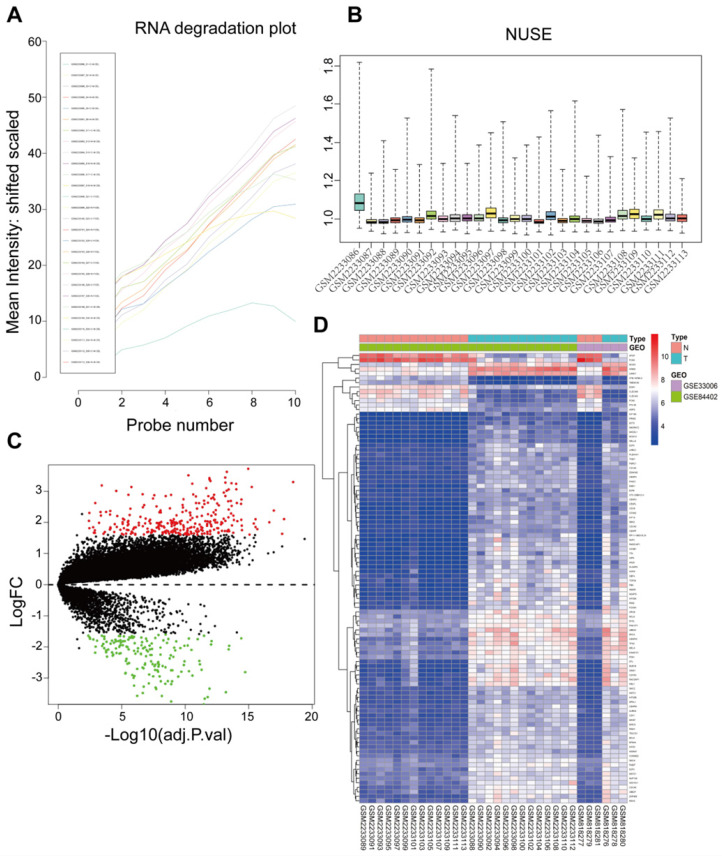
Figure 1.
Sample preprocessing and DEGs identified in GSE33006 and GSE84402. (A) The RNA degradation of all probe sets were detected using the affy package. The horizontal axis represents fragments of RNA from 5'end to 3'end, while the vertical axis represents the mean fluorescence intensity. GSM2233086 outliers were marked by a red arrow. (B) Normalized Unscaled Standard Errors of all probe sets in the datasets were displayed as bar charts through the affy package, the value 1 on the vertical axis means 100% of the untreated control, excellent quality chips have normalized NUSEs and RLEs near or lower than 1 (control value). Poor quality chips have normalized NUSEs and RLEs higher than 1. Only the GSM2233086 NUSE value was obviously higher than controls. Thus GSM22330086 and its corresponding adjacent normal sample GSM2233087 were split. (C) A Volcano map of DEGs between HCC tissues and adjacent normal liver tissues. Red dots represented upregulated genes and green dots represented downregulated genes. (D) A hierarchical clustering dendrogram of the top 100 DEGs based on the |logFC| value.

