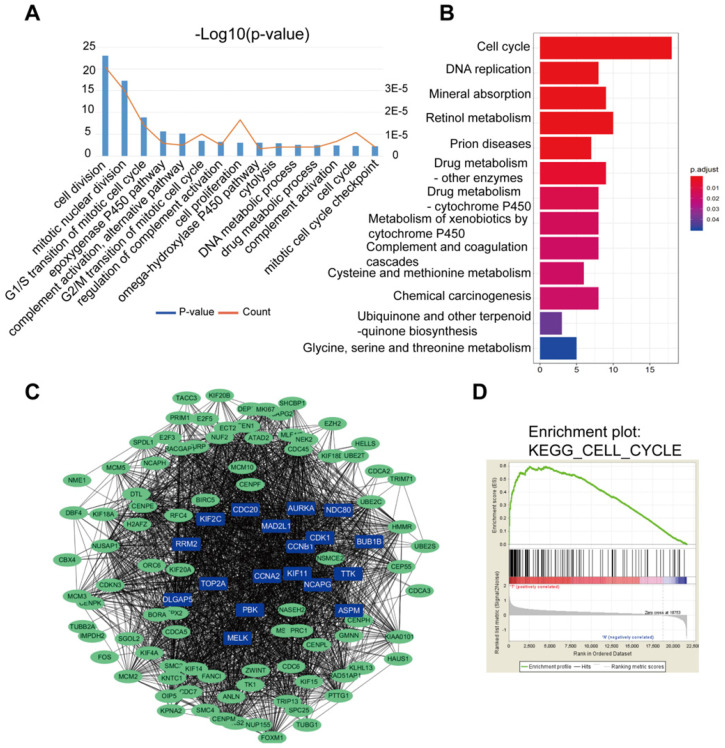
Figure 2.
DEGs of the two datasets based on GO, KEGG pathway, PPI nework and GSEA. (A) The top 15 GO annotations included biological process in the enrichment analysis of the DEGs. (B) The significant KEGG pathways in the enrichment analysis of DEGs. (C) Some DEGs were filtered into the PPI network that contained 108 nodes and 2369 edges. The color intensity in each node was proportional to change fold of expression compared to para-cancerous samples. (D) Gene set enrichment analysis (GSEA) for HCC samples and adjacent normal tissues. GSEA showed that significantly enriched gene sets were associated with cell cycle, p<0.05.

