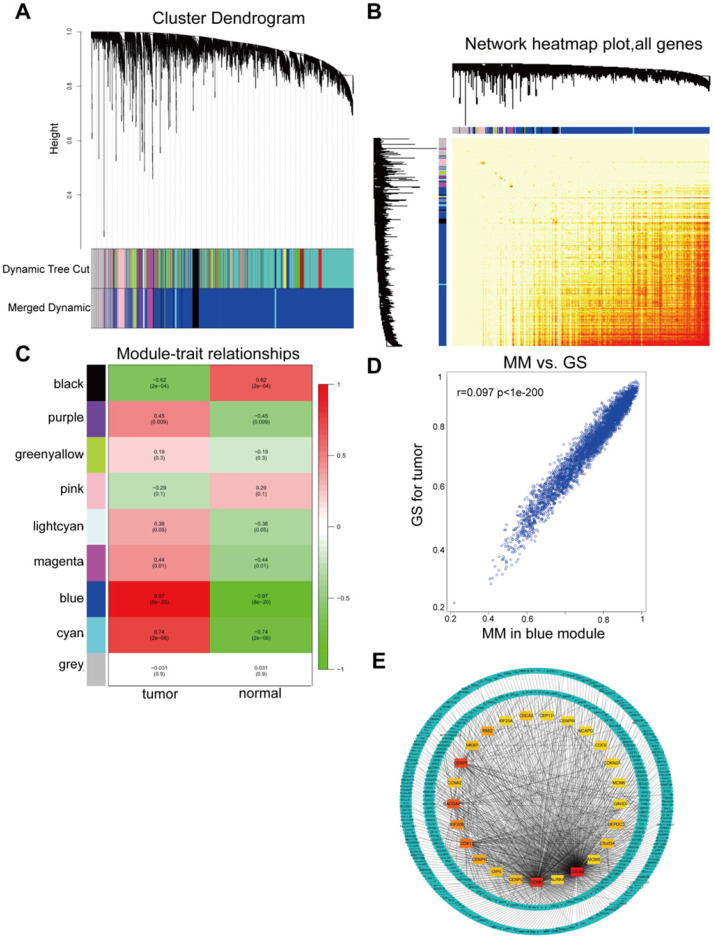
Figure 3.
WGCNA of GSE29570 and GSE89657 datasets. (A) Differentially expressed genes in 32 samples of HCC and adjacent para-cancerous were assigned to one of 9 moduleswith a cutoff powers =14. The top image represented all gene dendrograms, the bottom image represented gene modules with different colors. (B) Correlation between modules eigengenes and sample features. Each cell contained the corresponding correlation coefficient and P value. Among these, the blue and black modules were the most probable relevant modules with cancer traits. (C) A scatter diagram of the correlation between GS for HCC and the MM in the blue module. Intra-modular analysis of the genes in the blue module that show a strong relationship to HCC, with p<1e-200 and r =0.97. (D) A heatmap of all DEGs. The intensity of the red color represented the strength of the relationship between pairs of modules on a linear scale. (E) PPI network of hub genes identified by co-expression network analysis in the blue module. The color intensity of each node was proportional to change fold of expression in comparison to para-cancerous samples. The network contained 370 nodes and 3933 edges.

