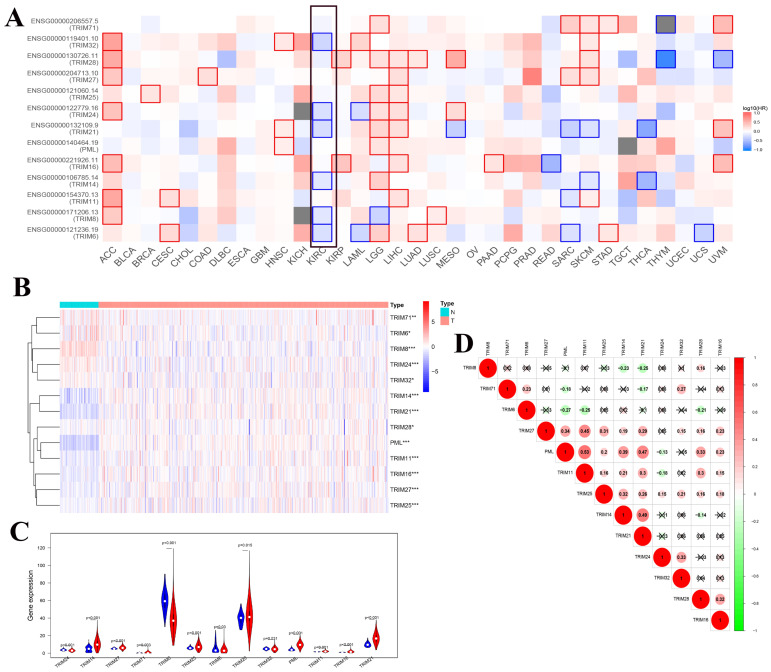
Figure 2.
Co-expression analysis of the 13 TRIM family genes and the relationship between expression in pan-cancer and overall survival. (A) Exploration of the overall survival of these 13 TRIM family genes in various tumors through the GEPIA website. The black frame indicates overall survival related to KIRC. (B) The expression levels of the genes in KIRC from TCGA. The higher the expression, the deeper the red color; the lower the expression, the deeper the blue color. (C) The expression of the genes in KIRC. Blue represents normal tissue and red represents tumor tissue. (D) Co-expression analysis of the genes. Red represents a positive correlation and green represents a negative correlation. *P < 0.05, **P < 0.01, and ***P < 0.001.

