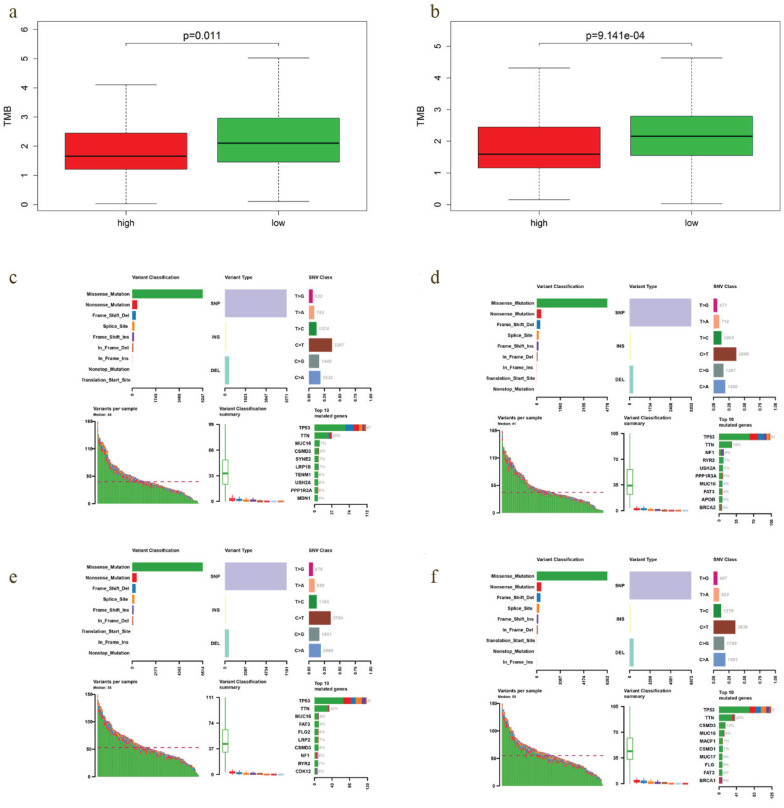
Figure 8.
TMB level and mutation profiling in EOCs with different prediction of survival. a-b TMB level of low-risk group was significantly higher in both OS (P = 0.011) and DFS model (P = 9.141e-04). c, e Mutation profiling of EOCs with high- and low-risk in OS model, respectively. d, f Mutation profiling of cases with high- and low-risk in DFS model, respectively.

