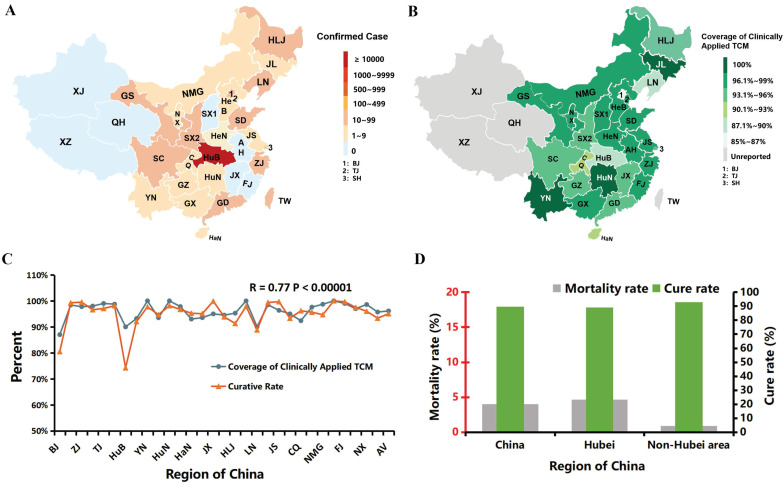
Figure 1.
The positive correlation of the curative rate of COVID-19 and the prevalence of regionally applied traditional Chinese medicine (TCM) in China. (Data source: National Administration of TCM.) (A) An epidemic map of China as of March 15. Xinjiang (XJ), Qinghai (QH), Xizang (XZ) and a few other provinces were free of COVID-19 (gray - blue). Other affected regions are marked with red tones, and the depth of color represents the number of remaining confirmed patients (Table S1). (B) A TCM coverage map of China. The depth of green positively correlates with the TCM coverage rate. The abbreviations of the corresponding provinces were the same as in Fig. 2A, except BJ (Beijing), TJ (Tianjin) and SH (Shanghai), which are named 1, 2 and 3, respectively, due to the limited space on the map. Table S1 shows the details. (C) Correlation curve between regional curative rate and TCM coverage rate (R=0.77, P<10-5). Table S1 presents the details. (D) Comparison of Hubei with non-Hubei regions to the cure rate as of March 24 is pictured in green, while the mortality rate is in gray. Concrete data are shown in Table S2.

