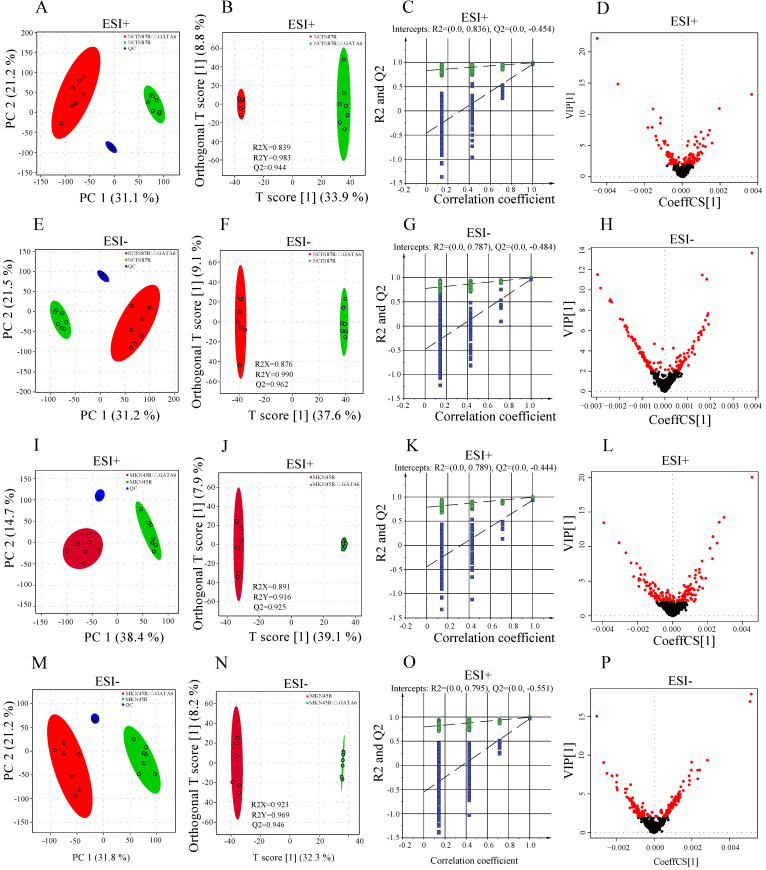
Figure 2.
Differential metabolomics profiling between NCI N87R and NCI N87R/ΔGATA6, MKN45R and MKN45R/ΔGATA6 cells. (A, E, I, M) PCA score plots of NCI N87R/ΔGATA6 and NCI N87R cells, MKN45R/ΔGATA6 and MKN45R cells in ESI+ and ESI-, respectively. (B, F, J, N) OPLS-DA score plots of NCI N87R/ΔGATA6 and NCI N87R cells, MKN45R/ΔGATA6 and MKN45R cells in ESI+ and ESI-, respectively. (C, G, K, O) Permutation test plots of NCI N87R/ΔGATA6 and NCI N87R cells, MKN45R/ΔGATA6 and MKN45R cells in ESI+ and ESI-, respectively. (D, H, L, P), VIP plots of NCI N87R/ΔGATA6 and NCI N87R cells, MKN45R/ΔGATA6 and MKN45R cells in ESI+ and ESI- respectively, red nodes represent corresponding variables with VIP > 1.0 in each group.

