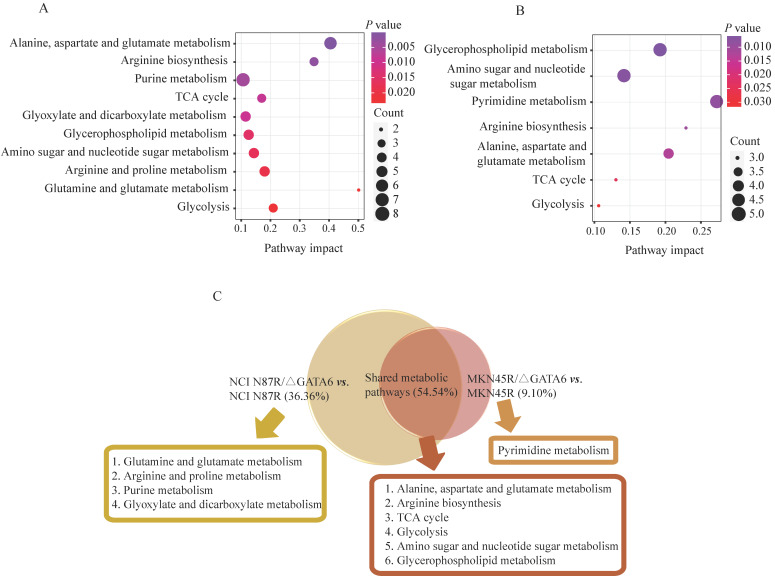
Figure 4.
Pathway enrichment analysis corresponding to the differential metabolites via MetaboAnalyst in (A) NCI N87/ΔGATA6 and NCI N87R, (B) MKN45/ΔGATA6 and MKN45R cells. x-axis represents the pathway impact value of topological analysis. Size of the nodes shows the number of matched metabolites, color of the nodes indicates p value of the enrichment analysis.

