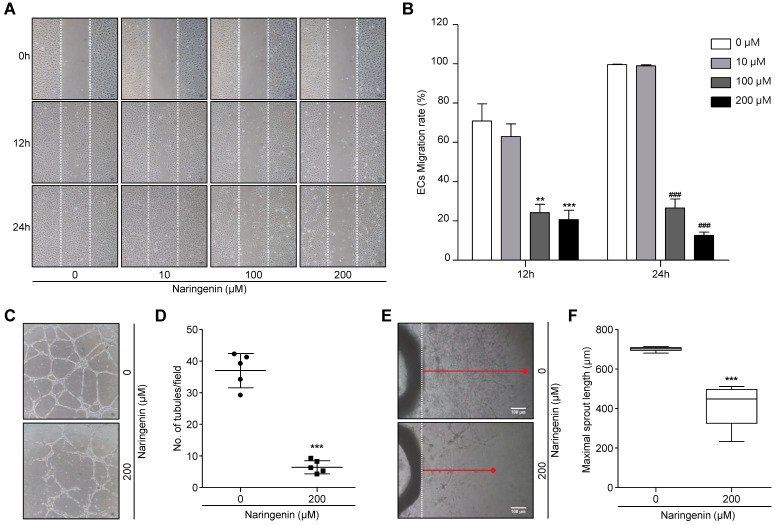
Fig 5.
Naringenin treatment inhibits angiogenesis in vitro and ex vivo. (A, B) Images showing HUVECs migration and comparisons of ECs migration rate. Data are presented as a percentage of scratched area at time 0 h. Magnification, 40×. Values are mean ± SD from ≥ three independent experiments. **p = 0.0013, ***p= 0.0003; ###p< 0.001 versus untreated group by two-way ANOVA followed by Bonferroni post-tests. (C, D) Images showing ECs tube formation and comparisons of number of tubules. Magnification, 100×.(E, F) Images showing sprouting of ECs from rat aorta and comparisons of maximal length of ECs sprouting.Magnification, 40×. Values are mean ± SD from ≥ three independent experiments. ***p< 0.0001 versus untreated group by unpaired t-test.

