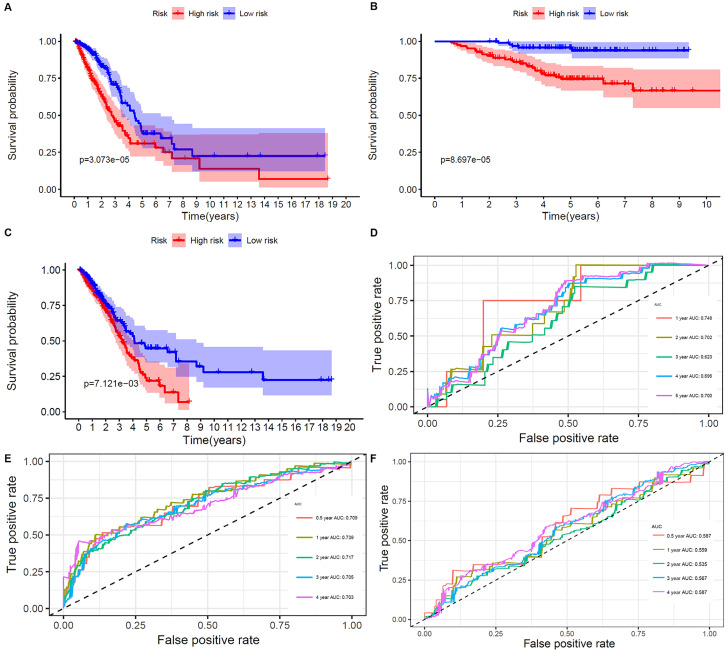
Figure 4.
Overall survival of the low- and high-risk groups. A, B, and C. The prognostic worth of the biomarkers. Patients in the high‐risk groups sustained a shorter survival time in both the training set, validation set, and the other metabolism-related prognosis model. D. ROC curve verifies the accuracy of the model in predicting the 1-, 2- , 3- ,4-, 5-year survival rates of LUAD patients in the validation set. E. ROC curve verifies the accuracy of the model in predicting the 0.5-, 1-, 2- , 3- ,4-year survival rates of LUAD patients in the training set. F. ROC curve verifies the accuracy of the other model in predicting the 0.5-, 1-, 2-, 3-, and 4-years survival rates of LUAD patients.

