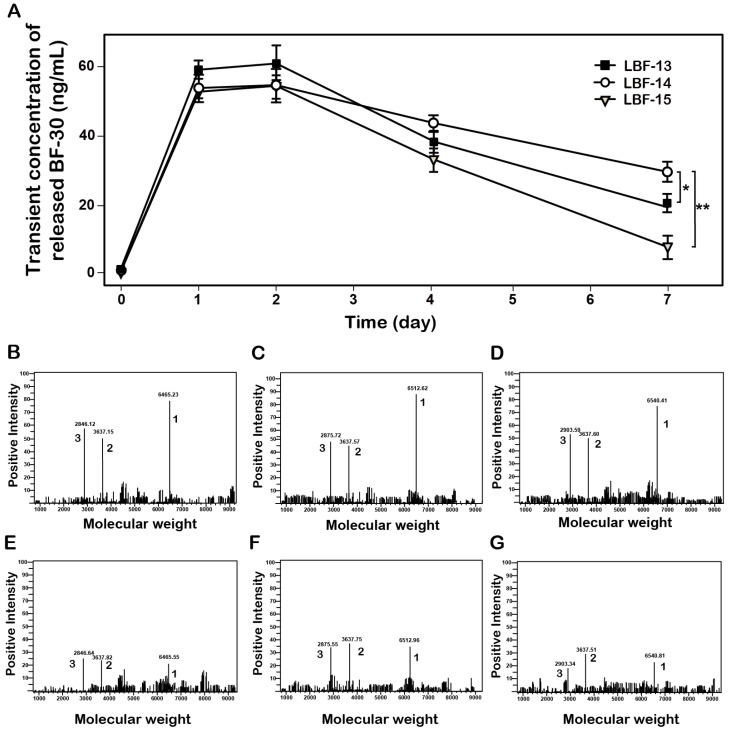
Figure 2.
Controlled release of the native BF-30 from three LBF peptides in vitro. (A) The transient concentration of the released BF-30-time curve. The mass spectrums of the enzymatic mixtures of LBF-13 at 1 day (B) and 7 day (E), LBF-14 at 1 day (C) and 7 day (F) or LBF-15 at 1 day (D) and 7 day (G) by thrombin. Peak 1, 2 and 3 refer to LBF polypeptides, albumin binding tags and released BF-30, respectively. **P < 0.01 and *P < 0.05. All data are expressed as mean ± SD (n=6).

