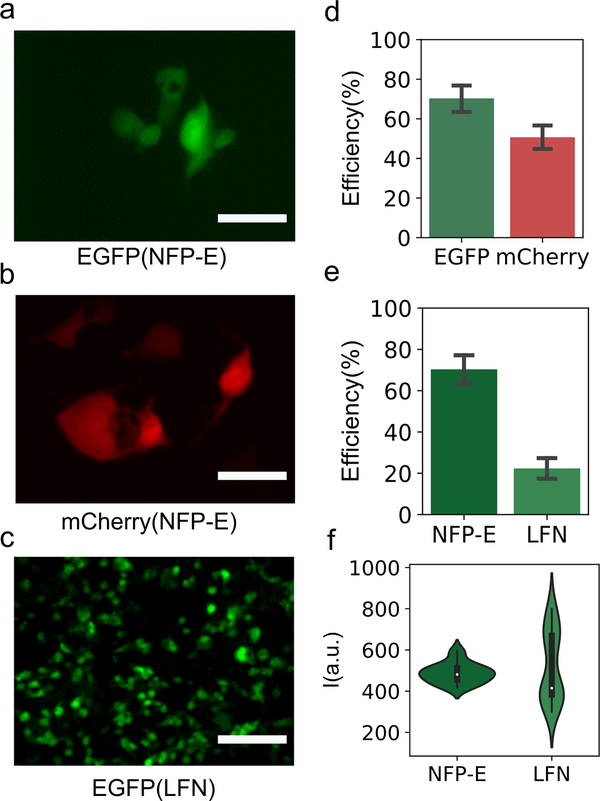
Figure 3.
Comparison of plasmid delivery using NFP-E and Lipofectamine (LFN). (a–c) Representative fluorescence images. a) HEK 293FT cells expressing EGFP after plasmid delivery with NFP-E, and b) HEK 293FT cells expressing mCherry after plasmid delivery with NFP-E. Scale bar: 20 μm. c) HEK 293FT cells expressing EGFP after plasmid delivery with LFN. Scale bar: 100 μm. d) Transfection efficiency for EGFP plasmid and mCherry plasmid with NFP-E. 126 cells were targeted with EGFP plasmid, and 110 cells were targeted with mCherry plasmid. e) Transfection efficiency with EGFP plasmid for NFP-E and LFN. Error bars indicate the standard error of the mean. f) Distribution of fluorescence intensity for EGFP-expressing cells transfected using NFP-E or LFN. In the violin plots, dots are the median, bars are the interquartile range, and lines are the ±1.5 interquartile range.

