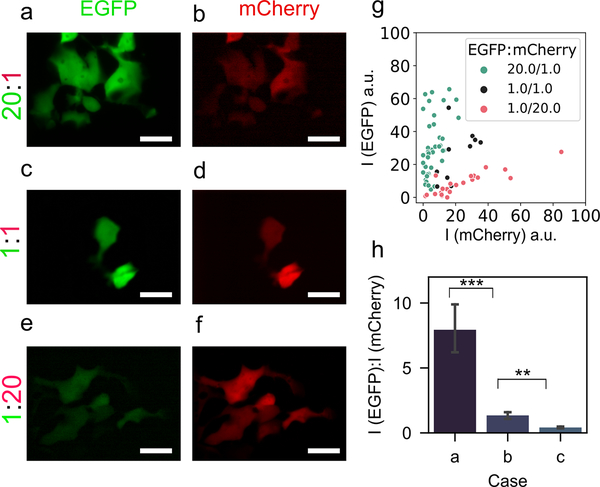
Figure 4.
Ratiometric delivery of EGFP plasmid and mCherry plasmid using NFP-E. Representative fluorescence micrographs showing the expression of EGFP (a, c, e) and mCherry (b, d, e) in HEK 293FT cells corresponding to 20:1, 1:1, and 1:20 EGFP-to-mCherry plasmid concentration ratios. Scale bar: 20 μm. g) EGFP and mCherry fluorescence intensities (in distinct arbitrary units) for the three different plasmid concentration ratios. Each data point represents a transfected cell. h) Relative fluorescence intensity ratios of EGFP and mCherry for the three cases a (20:1), b (1:1), and c (1:20). Each condition includes more than 10 cell measurements. *** (p < 0.001), ** (p < 0.01).

