Fig. 2.

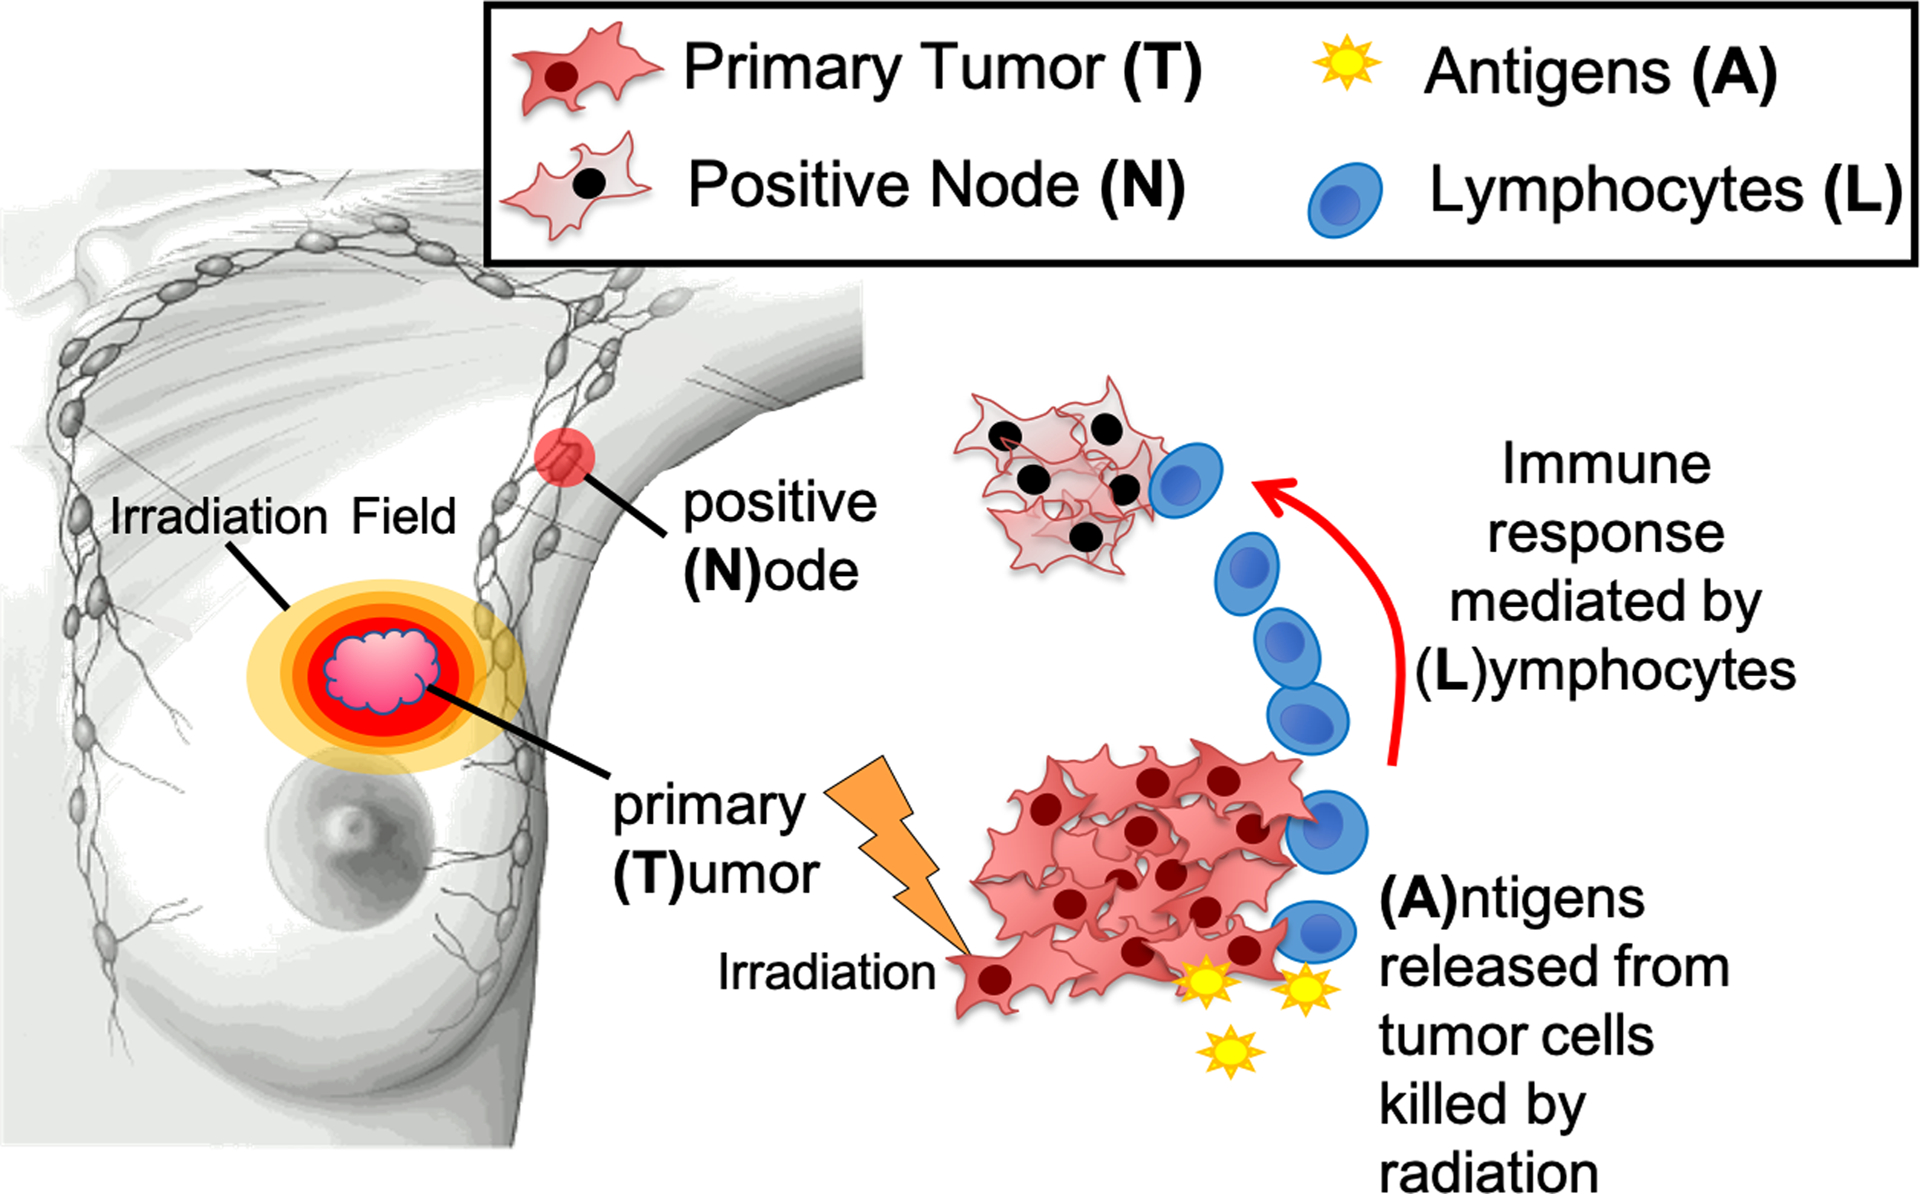
Model overview presenting the relationship between the primary tumor (T), antigen released (A), circulating lymphocytes (L), and the tumor cells in the positive node (N). Image created by Clemens Grassberger, PhD and Corey Speers, MD, PhD.

Model overview presenting the relationship between the primary tumor (T), antigen released (A), circulating lymphocytes (L), and the tumor cells in the positive node (N). Image created by Clemens Grassberger, PhD and Corey Speers, MD, PhD.