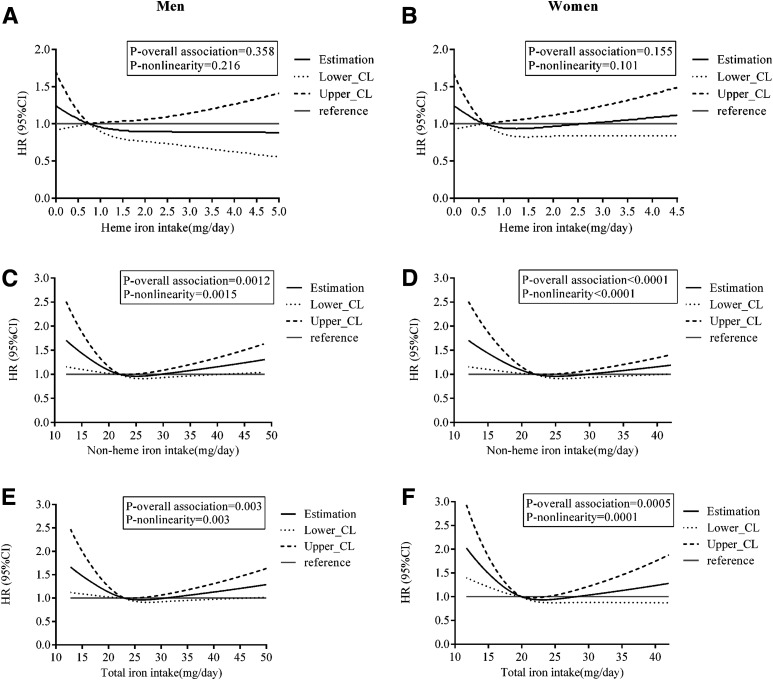
Figure 1.
Multivariable-adjusted HRs (black solid lines) and 95% CIs (dotted and dashed lines) for risk of diabetes according to dietary intake of heme (A and B), nonheme (C and D), and total (E and F) iron in men and women, respectively, in model 3. The median intakes were set as references (gray solid lines) (HR = 1.00). CL, confidence limit.

