
Fig. 4. Prioritizing functional RVs with Watershed.
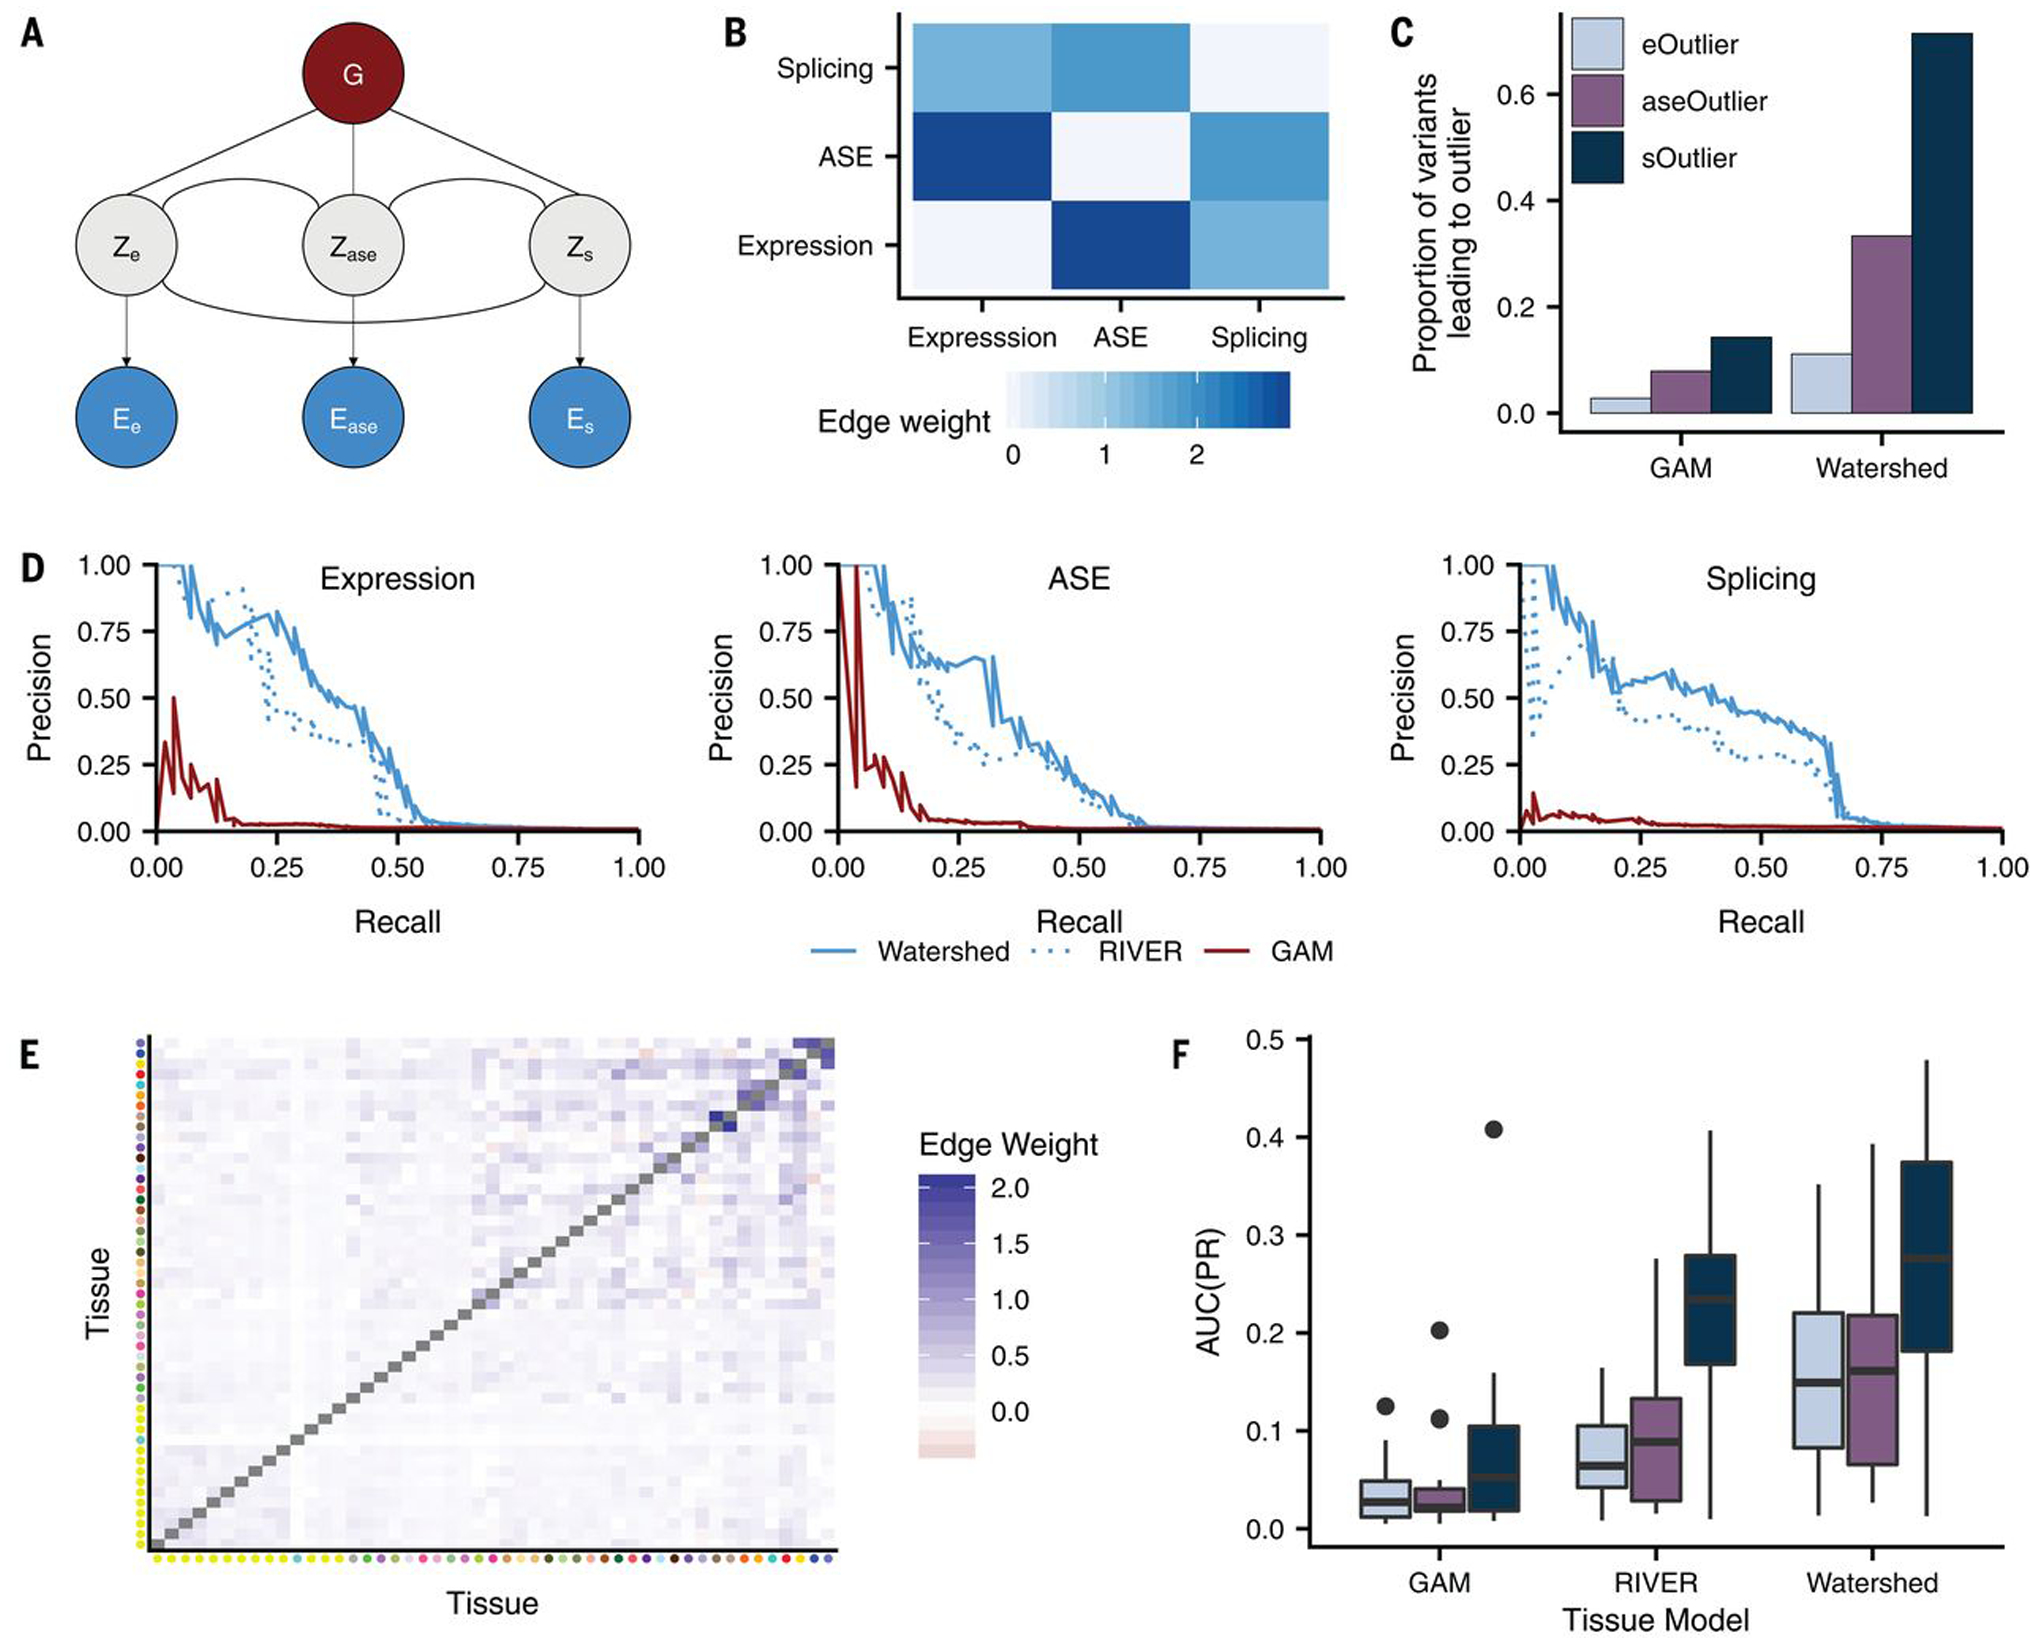
(A) Graphic summarizing plate notation for the Watershed model when it is applied to three median outlier signals (expression, ASE, and splicing). (B) Symmetric heatmap showing learned Watershed edge parameters (weights) between pairs of outlier signals after training Watershed on three median outlier signals. (C) The proportion of RVs with Watershed posterior probability >0.9 (right) and with GAM probability greater than a threshold set to match the number of Watershed variants for each outlier signal (left) that lead to an outlier at a median P-value threshold of 0.0027 across three outlier signals (colors). Watershed and GAM models were evaluated on held-out pairs of individuals. (D) Precision-recall curves comparing performance of Watershed, RIVER, and GAM (colors) using held-out pairs of individuals for three median outlier signals. (E) Symmetric heatmap showing learned tissue-Watershed edge parameters (weights) between pairs of tissue outlier signals after training tissue-Watershed on eOutliers across single tissues. Tissue color to tissue name mapping can be found in fig. S21D. (F) Area under precision recall curves [AUC(PR); y-axis] in a single tissue between tissue-GAM, tissue-RIVER, and tissue-Watershed (x-axis) when applied to outliers across single tissues in all three outlier signals (colors). Precision recall curves in each tissue were generated using held-out pairs of individuals.