
Figure 1. Flowchart of the experimental design.
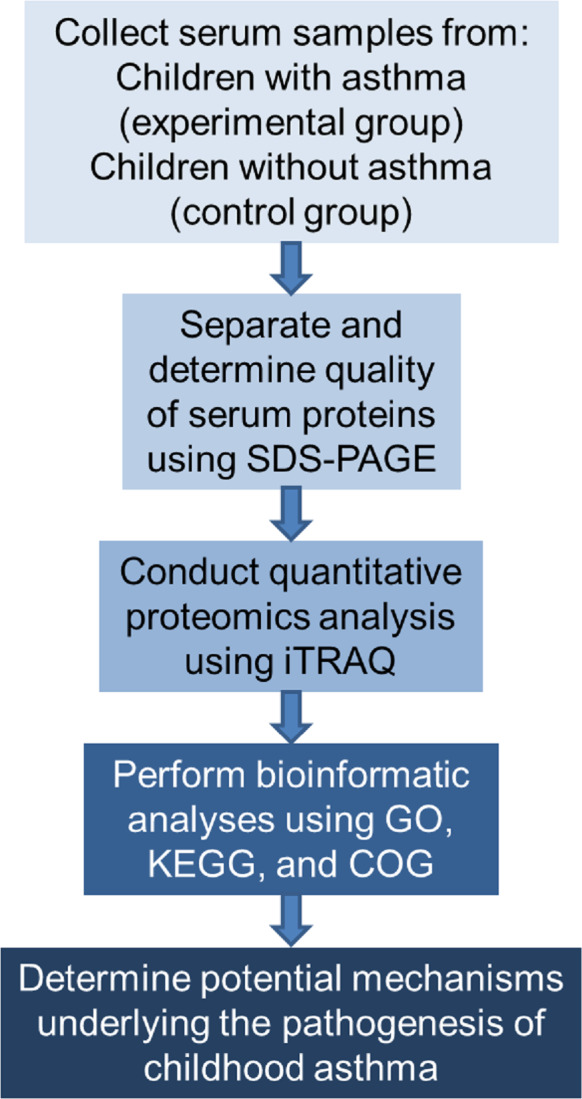
COG represents Clusters of Orthologous Groups; GO, Gene Ontology; KEGG, Kyoto Encyclopedia of Genes and Genomes; iTRAQ, isobaric tags for relative and absolute quantitation; and SDS-PAGE, sodium dodecyl sulfate–polyacrylamide gel electrophoresis.