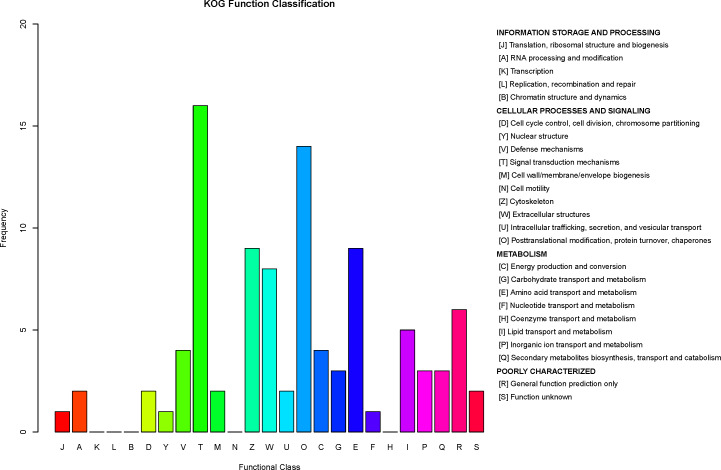
Figure 8. Clusters of Orthologous Groups (COGs) annotated for differentially expressed proteins.
The horizontal axis represents the functional code in the COG database, and the description of that code is shown on the right side of the figure. The y-axis indicates the frequency of each functional code.

