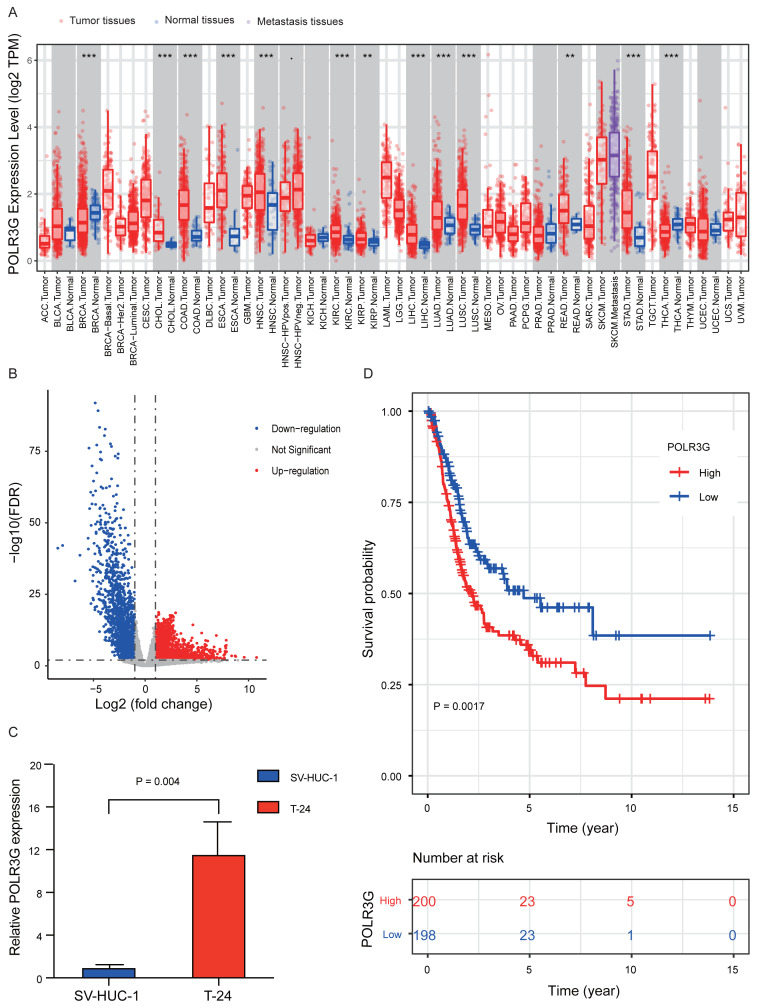
Figure 1. POLR3G expression in different disease states and survival curve of patients with TCC.
(A) Differential expressions of POLR3G in multiple cancer types analyzed by TIMER. P value significant codes: 0 ≤ *** < 0.001 ≤ ** < 0.01 ≤ * < 0.05 ≤ . < 0.1 (B) RNA-Seq differential expression analysis in TCC tissues and normal bladder tissues. (C) Differential expressions of POLR3G in T24 cells compared to SV-HUC-1 cells. (D) Impact of POLR3G expression on overall survival of patients with TCC in TCGA.

