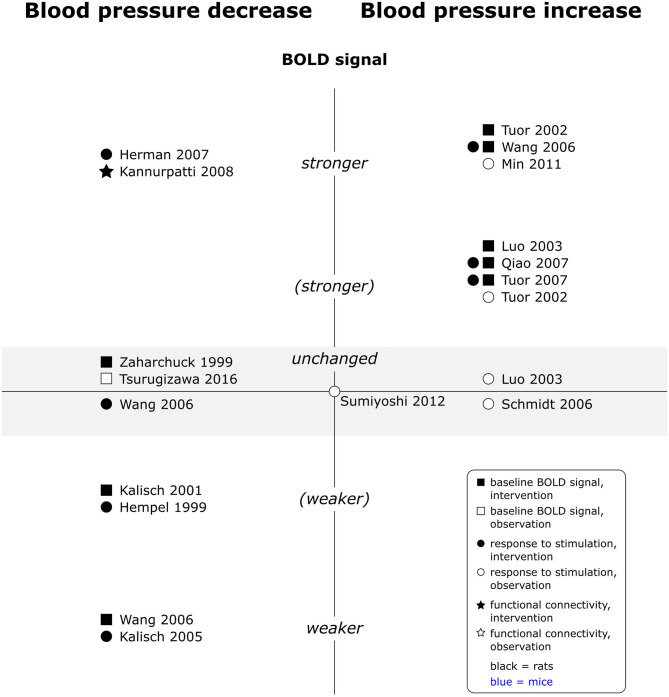
Figure 7.
Effects of decreases and increases in arterial blood pressure compared to respective baseline, on baseline BOLD signal, responses to stimulation and fc in rats (no studies available in mice). Datapoints displayed on the BOLD signal axis represent studies which have investigated associations between arterial blood pressure values and the respective BOLD outcome (in the absence of specific changes in arterial blood pressure). stronger = higher BOLD signal or lower R2*, higher signal intensity and/or spatial extent of activated area upon stimulation, or higher fc strength and/or spatial extent of connectivities; (stronger) = BOLD signal, response to stimulation or fc stronger in some, but not all aspects; unchanged = no significant difference to respective baseline condition or no association with paO2 fluctuations found. “weaker” and “(weaker)” analogous to “stronger” and “(stronger).” One data point per experimental paradigm and per dataset. If no statement on the significance of reported changes was available, “(stronger)” or “(weaker)” were selected.

