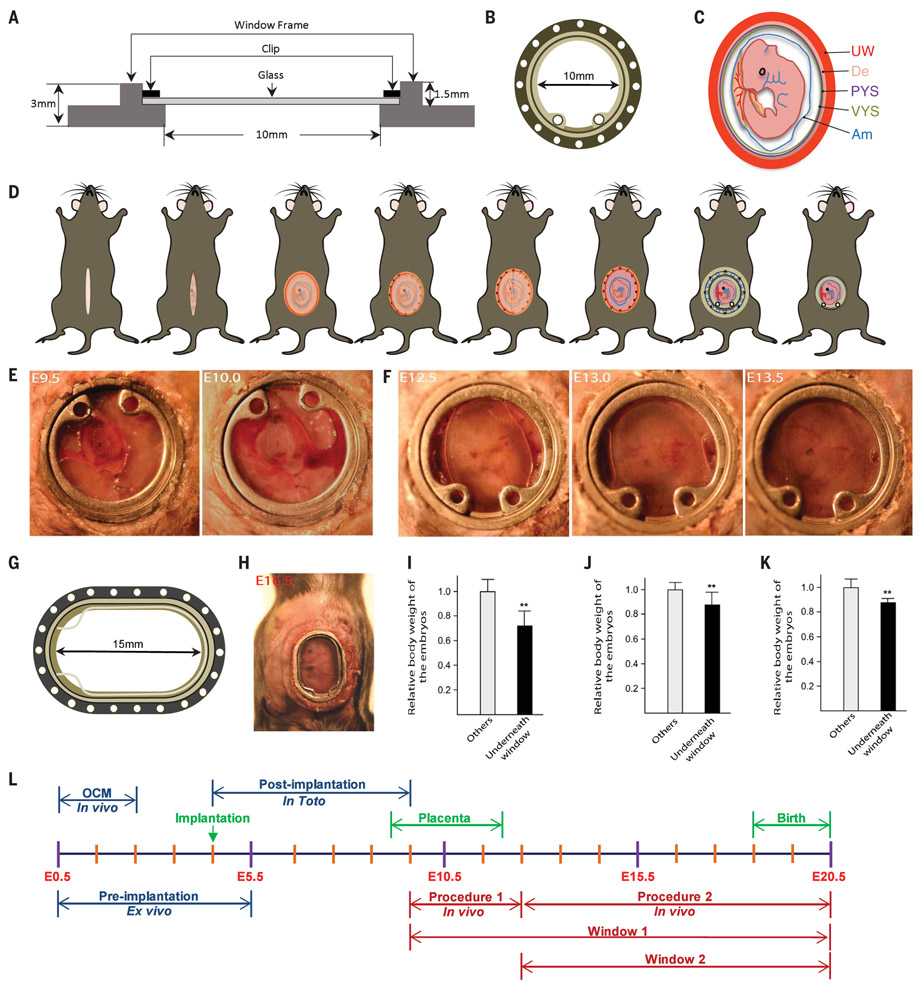
Fig. 1. Intravital imaging of mouse embryos.
(A and B) Schematic illustration of (A) side view and (B) top view of the embryonic window. (C) Illustration of a mouse embryo at E9.5. UW, uterine muscle; De, decidua; PYS, parietal yolk sac; VYS, visceral yolk sac; Am, amnion. (D) Overview of the stripping surgical protocol. (E) Embryo growth from E9.5 to E10.0. (F) Embryo growth from E12.5 to E13.5. (G and H) An elliptical window used for imaging later stages. (G) Schematic illustration of the elliptical window. (H) View of the elliptical window at E16.5. (I to K) Embryo weights at (I) E14.5, 3 days after stripping surgery; (J) E15.5; and (K) E18.5, 3 days after nonstripping surgery. Data are mean ± SD; n = 3 dams, **P < 0.01. (L) Timeline of embryo development and imaging procedures.

