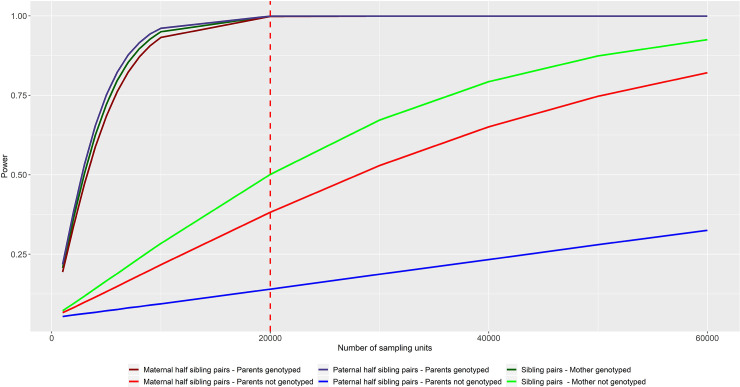
Fig 4. Power to resolve an autosomal maternal genetic effect (d2 = 0.1%; f 2 = 0%; b2 = 0%;) at a known genetic locus, using a conditional one degree of freedom test of association in sibling pairs (green lines), maternal half sibling pairs who share the same mother (red lines) and paternal half sibling pairs who share the same father (blue lines).
All calculations assume p = 0.3 frequency of the trait decreasing allele; shared variance φ2 = 0.2; type 1 error rate α = 0.05). The red dashed vertical line in the figure indicates the approximate number of sibling pairs in the UK Biobank (N = 20,000). This figure highlights the advantage of having actual parental genotypes in the statistical model.

