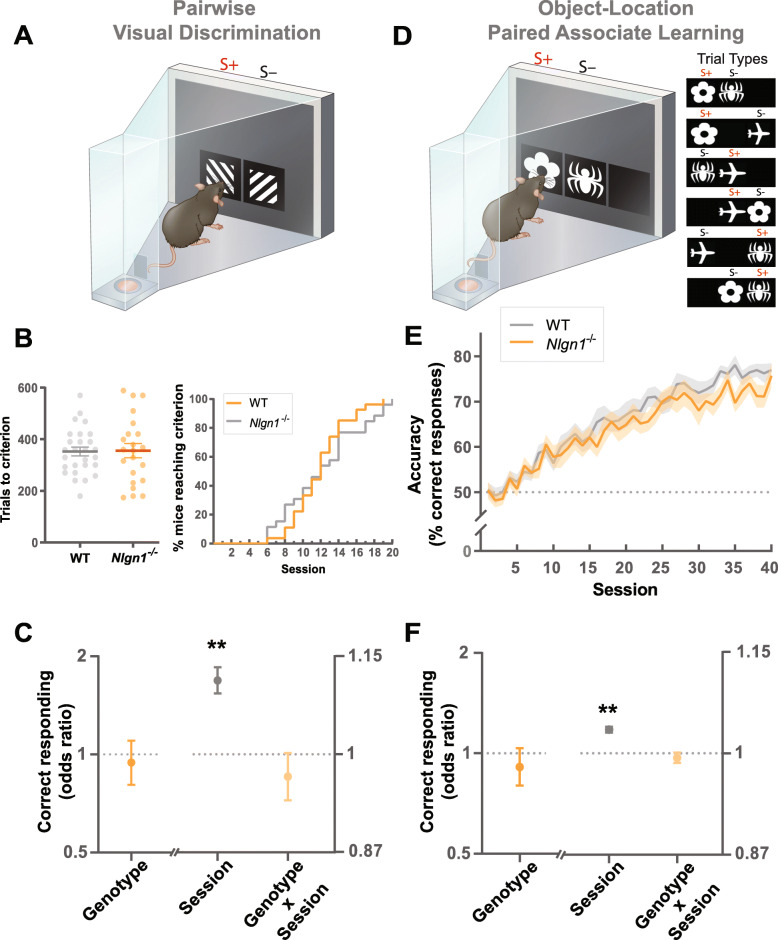
Fig. 1.
Nlgn1−/− mice display normal associative learning. a–c Pairwise visual discrimination learning task. a Stimuli used, S+ (rewarded stimulus), S−(unrewarded stimulus). b Number of trials to reach learning criterion; two-way ANOVA, values represent means ± SEM. Percentage (%) of mice reaching learning criterion across sessions. c Effect of genotype, session, and their interaction on correct responding, GLLAMM (logistic link function), **p < 0.005 significantly different from 1, values represent the estimated effect of the variables on the odds of correct responding (odds ratio) ± 95% CI. d–f Object-location paired associate learning task. d Visual stimuli and their paired correct locations (6 possible trial types). e Visuospatial learning curve showing performance accuracy across sessions, values represent means ± SEM. f Effect of genotype, session, and their interaction on correct responding, GLLAMM (logistic link function), **p < 0.005 significantly different from 1, values represent odds ratio ± 95% CI

