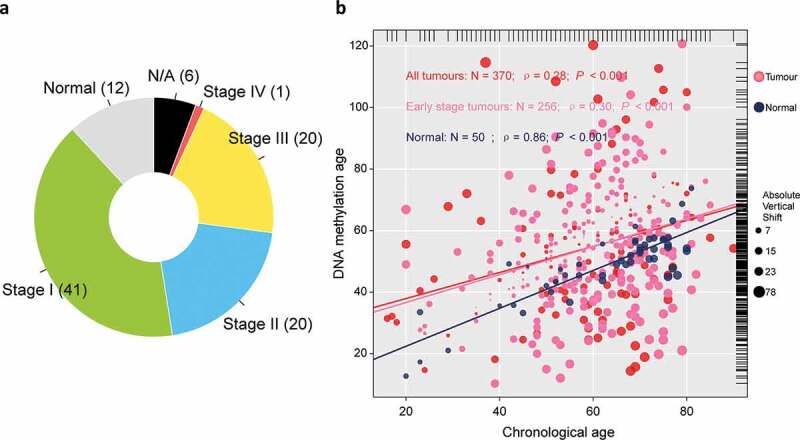
Figure 1.

Overview of sample selection, and correlations between DNAm age and chronological age. (a) The pie chart shows the proportion of normal samples and tumor samples at different stage. A total of 24 (6%) tumor samples without available stage information are labeled as “N/A,” (b) DNAm age of 50 normal hepatic samples can predict chronological age with decent correlation coefficient, whereas such correlation descended largely in either entire TCGA tumor cohort of 370 samples (red or pink dots) or early stage tumors with 256 samples (pink dots). The top and right marginal rug line describes the distribution of chronological age and DNAm age, respectively
