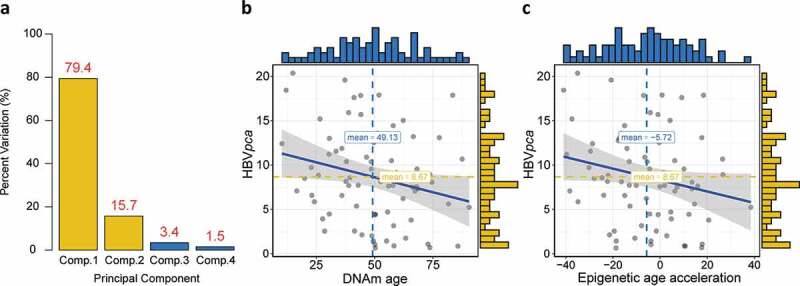
Figure 2.

Construction of , and its association with DNAm age or epigenetic age acceleration. (a) Barplot demonstrates that the first and second principal components covered almost all the variations with a summing percentage of 95.1%. Significant negative correlations between and either DNAm age or epigenetic age acceleration are shown in (b) and (c), respectively
