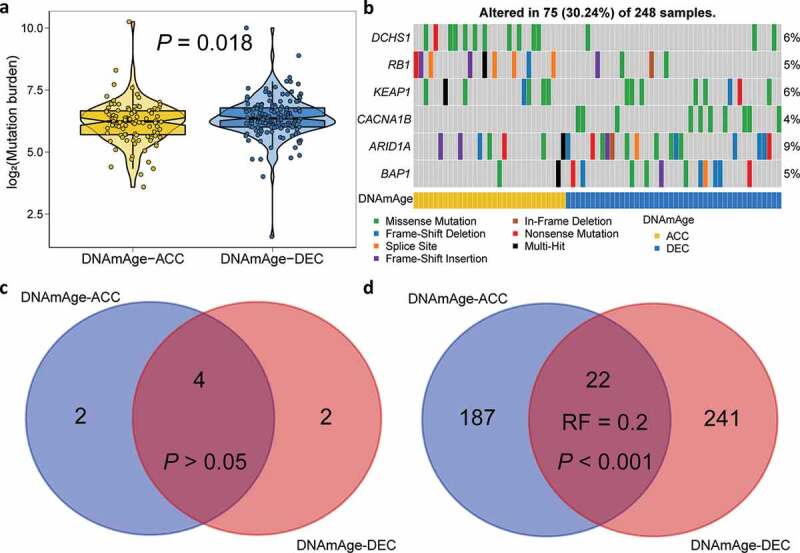
Figure 4.

Mutation landscape of two DNAm age groups. (a) Violin plot shows lower tumor mutation burden in DNAmAge-ACC group as compared to DNAmAge-DEC group. (b) Mutational oncoprint depicts differential mutated genes for two DNAm age groups, including fisher’s exact test-based independent mutated genes and significantly mutated genes (SMGs) identified by MutSigCV algorithm. Common and group-specific SMGs under either stringent (q < 0.05) and loose (P < .05) criteria of MutSigCV algorithm were displayed by Venn diagrams in (c) and (d), respectively. Representation factor (RF) and the associated probability were calculated to infer the statistical significance of the overlap between two groups of genes where a RF < 1 indicates less overlap than expected of two independent groups
