
Figure 1.
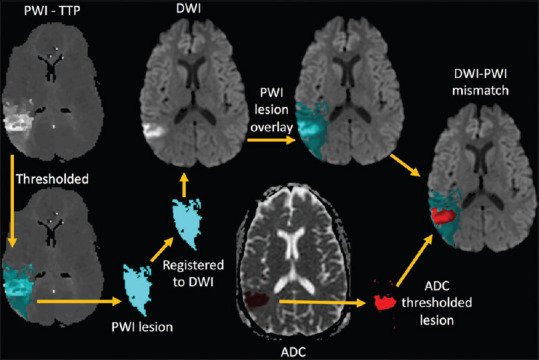
A schematic of how the diffusion–perfusion mismatch was calculated is shown. Perfusion-weighted imaging lesion masks (blue region) were created by applying a threshold of 4 s beyond normal tissue on the time-to-peak maps. The perfusion-weighted imaging lesion mask was transformed using the co-registration matrix and superimposed on the diffusion-weighted imaging. The core infarct (red region) was identified on the apparent diffusion coefficient maps of the diffusion-weighted imaging by applying a threshold of 620 μm/s. The volume of the perfusion-weighted imaging lesion (blue) divided by the volume of core infarct (red) determined the mismatch ratio