
Figure 4.
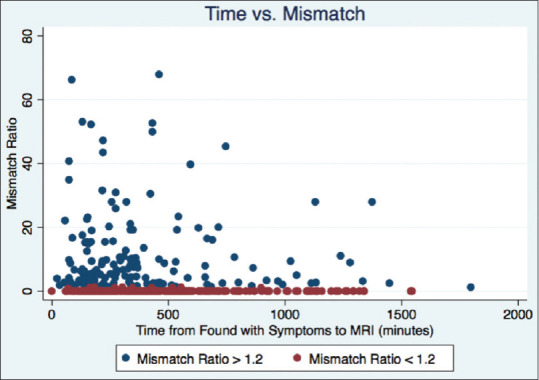
A scatter plot shows the relationship between the time from when the patient was found with symptoms to the time of magnetic resonance imaging (in minutes) and the mismatch ratio. Blue dots have a mismatch ratio >1.2 and red dots are <1.2. Of note, two patients were excluded from the graph due to having very high mismatch ratios (>80) in order to prevent the graph from having too large a scale on the y-axis