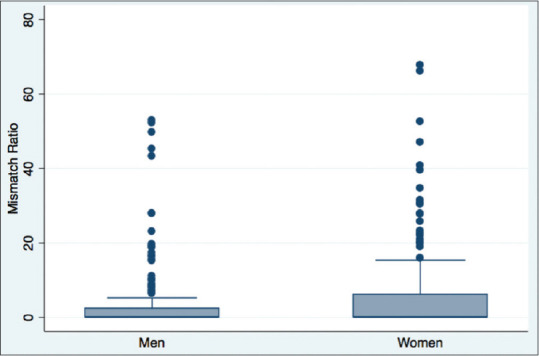
Figure 5.

A boxplot shows the difference in mismatch ratios between men and women. Of note, two patients were excluded from the graph due to having very high mismatch ratios (>80, both women) in order to prevent the graph from having too large a scale on the y-axis
