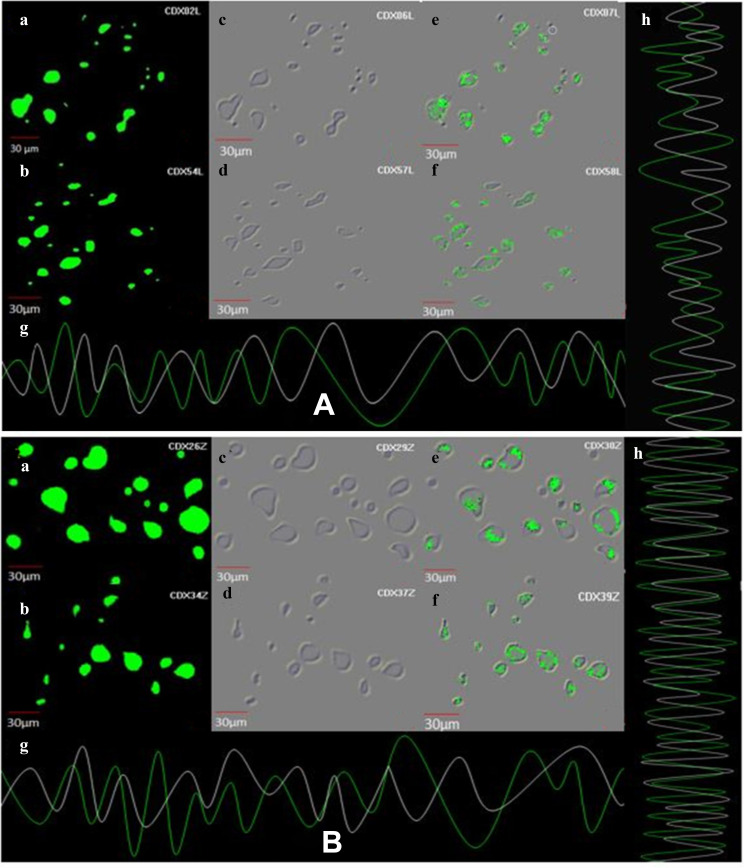
Figure 10.
(A) Demonstration of cell uptake assay by CLSM, images at 6 h and 12 h (a and b) showing cell uptake of fungal extract, images (c and d) exhibiting cell uptake by fungal extract on human MDA-MB 134 mammary gland carcinoma cell lines exhibiting under the green fluorescence channel along with differential interface contrast images at 6 h and 12 h, image (e and f) shows the caspase-3 reagents along with fungal extract binding to the nuclei of cancer cell lines images at 6 h and 12 h. (g and h) demonstrating superimposition of figures showing vertical and horizontal line series analysis of fluorescence of figure along the white line. (B) Demonstration of cell uptake assay by CLSM at 6 h and 12 h, images (a and b) showing cell uptake of ZnO NPs, images (c and d) exhibiting cell uptake by ZnO NPs on human MDA-MB 134 mammary gland carcinoma cell lines exhibiting under the green fluorescence channel along with differential interface contrast images at 6 h and 12 h (e and f) shows the caspase-3 reagents along with ZnO NPs binding to the nuclei of cancer cell lines image at 6 h and 12 h. (g and h) demonstrating superimposition of figures showing vertical and horizontal line series analysis of fluorescence of figure along the white line.

