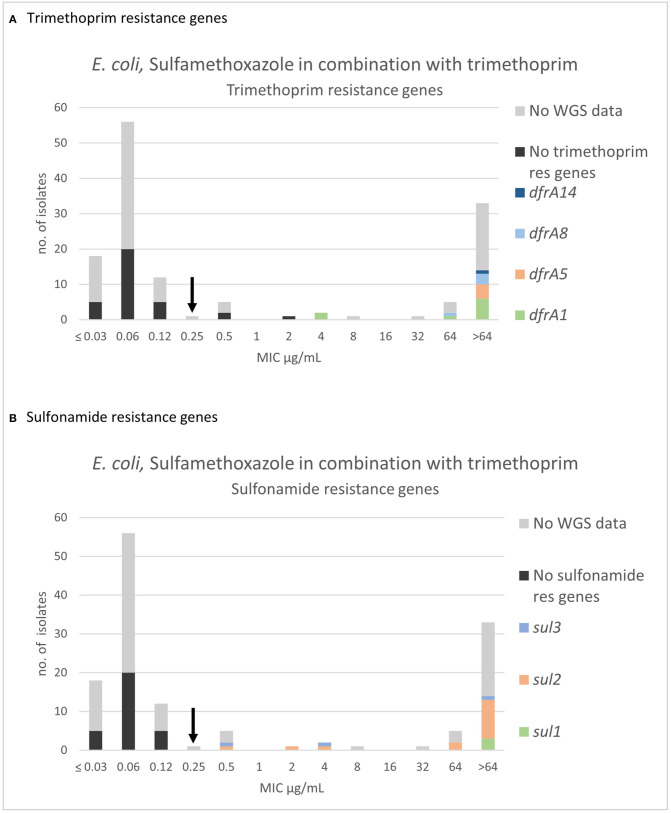
Figure 6.
MIC distribution of E. coli (n = 135) against sulfamethoxazole in combination with trimethoprim (19:1) in the test range of 0.03–64 μg/mL. The arrow indicates the epidemiological cut-off value (ECOFF, EUCAST). Colors indicate if the isolates have been sequenced (n = 51) and whether they harbor known (A) trimethoprim resistance gene and/or (B) sulfonamide resistance genes. WGS, whole-genome sequencing; res, resistance.

