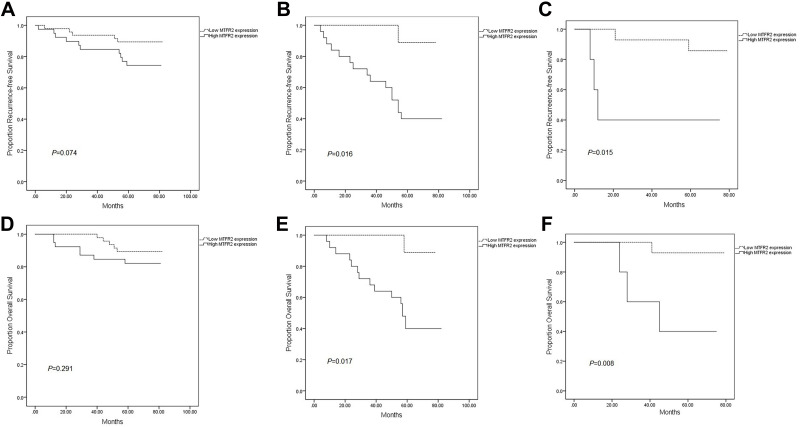
Figure 3.
Kaplan–Meier plots of RFS and OS according to MTFR2 expression level in each subtype. RFS differed significantly according to MTFR2 expression in the HER2 and TNBC subtypes (B and C), but it did not differ in the other subtypes (A). OS differed significantly according to MTFR2 expression in the HER2and TNBC subtypes (E and F), but it did not differ in luminal/HER2 negative (D). P values were calculated by Log rank tests.

