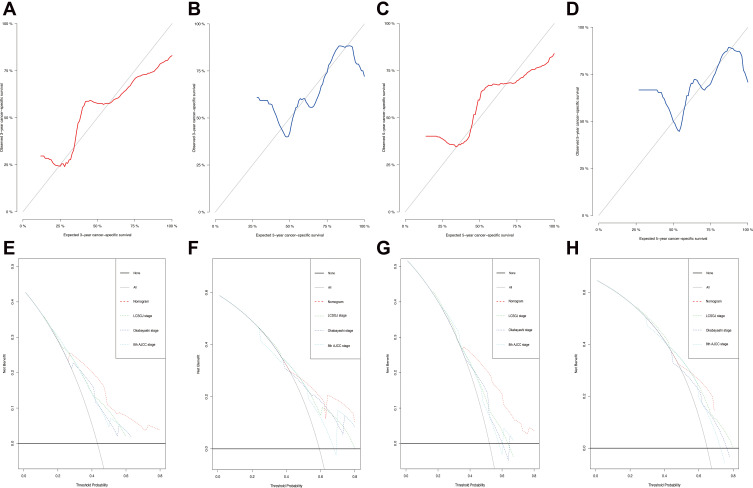
Figure 4.
The 3-year and 5-year calibration curves for the training set (A and C, red) and validation set (B and D, blue). The X-axes represent the mean predicted mortality probability according to the prediction model. The Y-axes represent the observed cumulative incidence of mortality. The grey diagonal line indicates equality between the predicted and observed values. Decision curve analysis was used to compare the clinical net benefit of our nomogram with that of the Okabayashi staging system, the Liver Cancer Study Group of Japan (LCSGJ) staging system, and the 8th edition AJCC staging system in terms of the 3-year and 5-year survival of elderly iCCA patients in the training set (E and G) and validation set (F and H).

