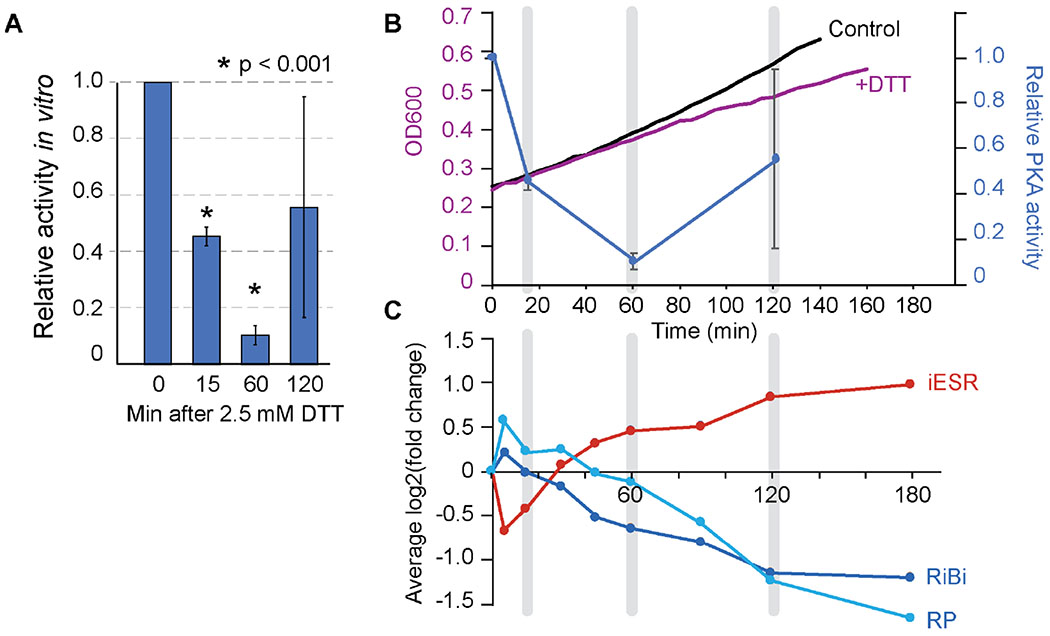
Figure 5. PKA activity relative to other aspects of the cellular response.
(A) Average and standard deviation of in vitro PKA activity from cell lysate at various times after DTT treatment (n = 3). Timepoints statistically different from the unstressed cells are indicated with an asterisk (p<0.001). (B) Overlay of the relative PKA activity measured in (A) (blue graph) versus change in optical density (OD600) shown in Figure 1 (black, purple). (C) Comparison to the average expression change of genes induced in the ESR (iESR) or repressed as part of the ribosomal protein (RP) or ribosome biogenesis (RiBi) gene groups 73, taken from 17. Corresponding timepoints in (B) and (C) are highlighted in grey.

