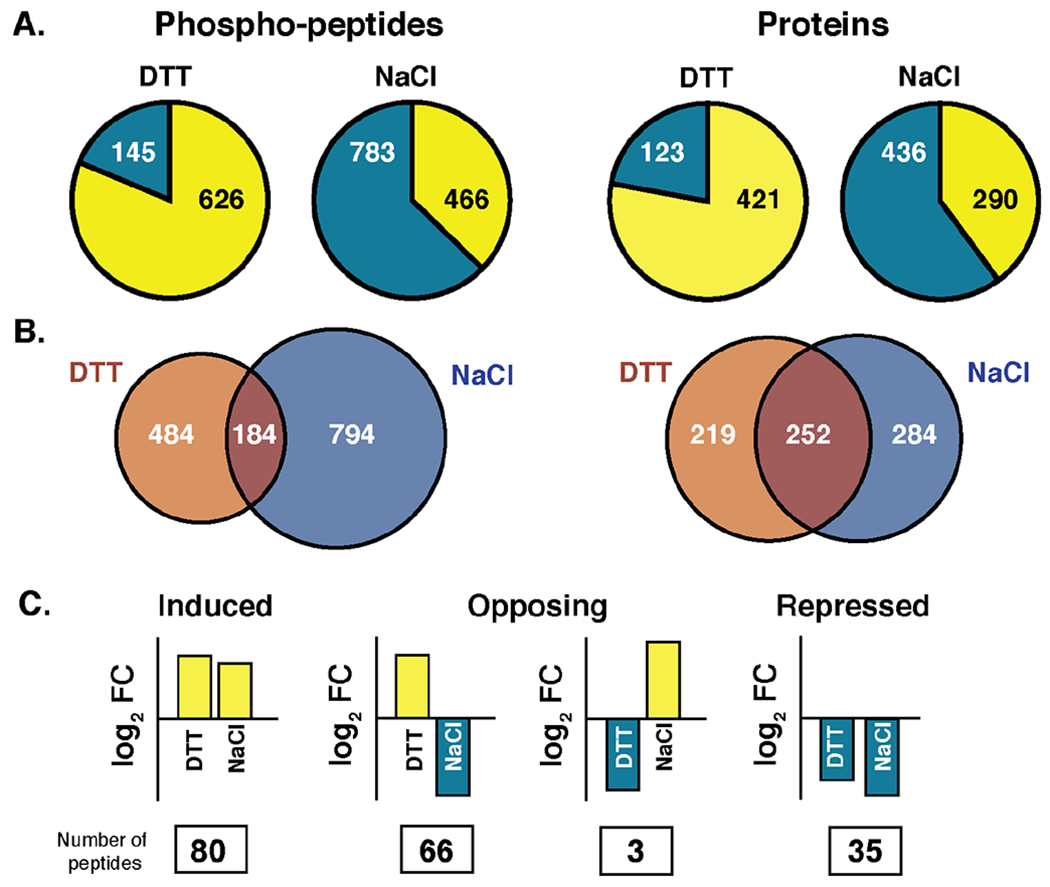
Figure 6. Common and condition-specific responses to DTT and NaCl.

(A) Number of phosphopeptides (left) or proteins (right) with increased (yellow) or decreased (blue) phosphorylation 120 min after DTT or 5 min after NaCl. Note proteins can be counted as having both increased and decreased phosphorylation if multiple residues were affected. (B) Overlap in proteins (left) or phosphopeptides (right) that were scored as having a change in phosphorylation in response to each stress. (C) Of the 184 peptides scored as changing in both studies, the number that was induced or repressed in both studies or showed opposing phosphorylation changes according to the cartoon is listed.
