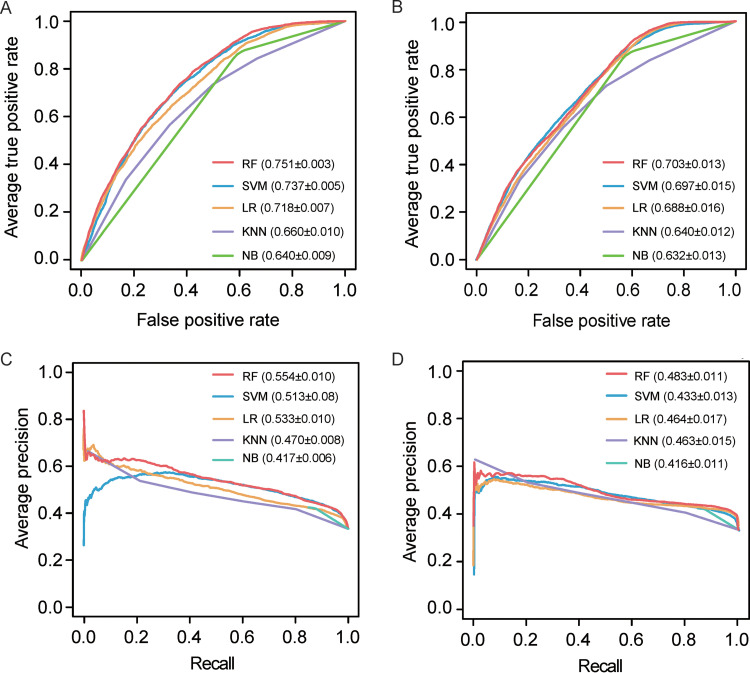
FIG 2.
Performance comparison of prediction models based on different machine learning methods. (A) ROC curves of the 5-fold cross-validation. (B) ROC curves of the independent test. (C) PR curves of the 5-fold cross-validation. (D) PR curves of the independent test. Parameters in parentheses in panels A and B denote the AUC values of different models, while parameters in parentheses in panels C and D stand for the AUPRC values. Note that the AUC/AUPRC values are reported as average ± standard deviation (SD).

