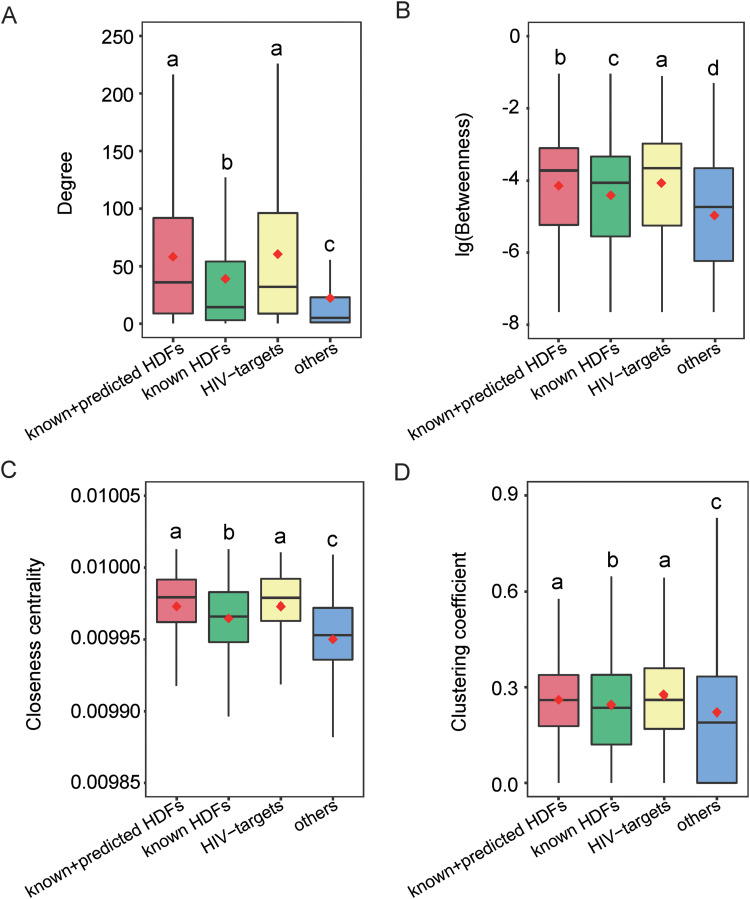
FIG 4.
Comparison of topological parameters among HDF candidates (i.e., predicted and known HDFs), known HDFs, HIV targets, and other human proteins. Note that “others” denotes 2,000 randomly selected human proteins other than known HDFs or HIV targets. Panels A to D show the distributions of degree, betweenness, closeness, and the clustering coefficient, respectively. The red diamond stands for the average value. Different lowercase letters indicate significant differences (P < 0.05) determined by one-tailed Wilcoxon rank sum test.

