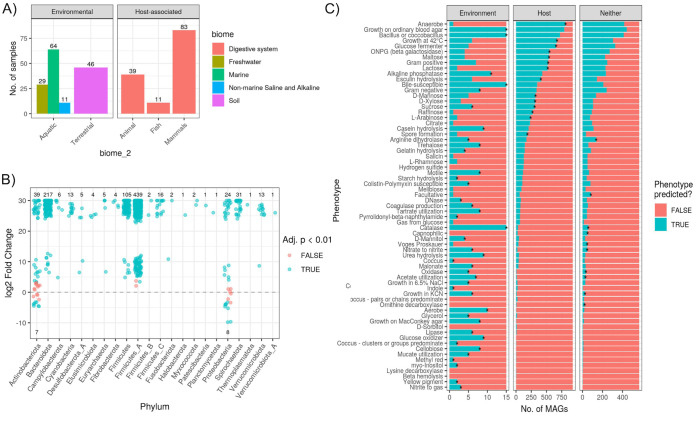
FIG 3.
(A) Summary of the number of samples per biome for our multienvironment metagenome data set selected from the MGnify database. (B) Number of SGBs found to be significantly enriched in relative abundances in host (positive log2-fold change [“l2fc”]) versus environmental (negative l2fc) metagenomes. Values shown are the number of MAGs significantly enriched (blue) in either biome or not found to be significant (red). (C) Host- and environment-enriched SGBs have distinct traits. Phenotypes predicted based on MAG gene content (via Traitar [26]) are summarized for the SGBs significantly enriched in host or environmental metagenomes (DESeq2 adjusted P value of <0.01) or neither biome (“Neither” in the x axis facet). Note the difference in the x axis scale. Asterisks denote phenotypes significantly more prevalent in SGBs of the particular biome than in a null model of 1,000 permutations in which biome labels were shuffled among SGBs. See Table S3A in the supplemental material for all DESeq2 results. ONPG, o-nitrophenyl-β-d-galactopyranoside.

